Log aggregation with Spring Boot, Elastic Stack and Docker
In a microservices architecture, a single business operation might trigger a chain of downstream microservice calls, which can be pretty challenging to debug. Things, however, can be easier when the logs of all microservices are centralized and each log event contains details that allow us to trace the interactions between the applications.
This post demonstrates how to use Elastic Stack along with Docker to collect, process, store, index and visualize logs of Spring Boot microservices.
An example of the approach described in this post is available on GitHub.
What is Elastic Stack? #
Elastic Stack is a group of open source applications from Elastic designed to take data from any source and in any format and then search, analyze, and visualize that data in real time. It was formerly known as ELK Stack, in which the letters in the name stood for the applications in the group: Elasticsearch, Logstash and Kibana. A fourth application, Beats, was subsequently added to the stack, rendering the potential acronym to be unpronounceable. So ELK Stack became Elastic Stack.
Let’s have a quick look at each component of Elastic Stack.
Elasticsearch #
Elasticsearch is a real-time, distributed storage, JSON-based search, and analytics engine designed for horizontal scalability, maximum reliability, and easy management. It can be used for many purposes, but one context where it excels is indexing streams of semi-structured data, such as logs or decoded network packets.
Kibana #
Kibana is an open source analytics and visualization platform designed to work with Elasticsearch. Kibana can be used to search, view, and interact with data stored in Elasticsearch indices, allowing advanced data analysis and visualizing data in a variety of charts, tables, and maps.
Beats #
Beats are open source data shippers that can be installed as agents on servers to send operational data directly to Elasticsearch or via Logstash, where it can be further processed and enhanced. There’s a number of Beats for different purposes:
- Filebeat: Log files
- Metricbeat: Metrics
- Packetbeat: Network data
- Heartbeat: Uptime monitoring
- And more.
As we intend to ship log files, Filebeat will be our choice.
Logstash #
Logstash is a powerful tool that integrates with a wide variety of deployments. It offers a large selection of plugins to help you parse, enrich, transform, and buffer data from a variety of sources. If the data requires additional processing that is not available in Beats, then Logstash can be added to the deployment.
Putting the pieces together #
The following illustration shows how the components of Elastic Stack interact with each other:
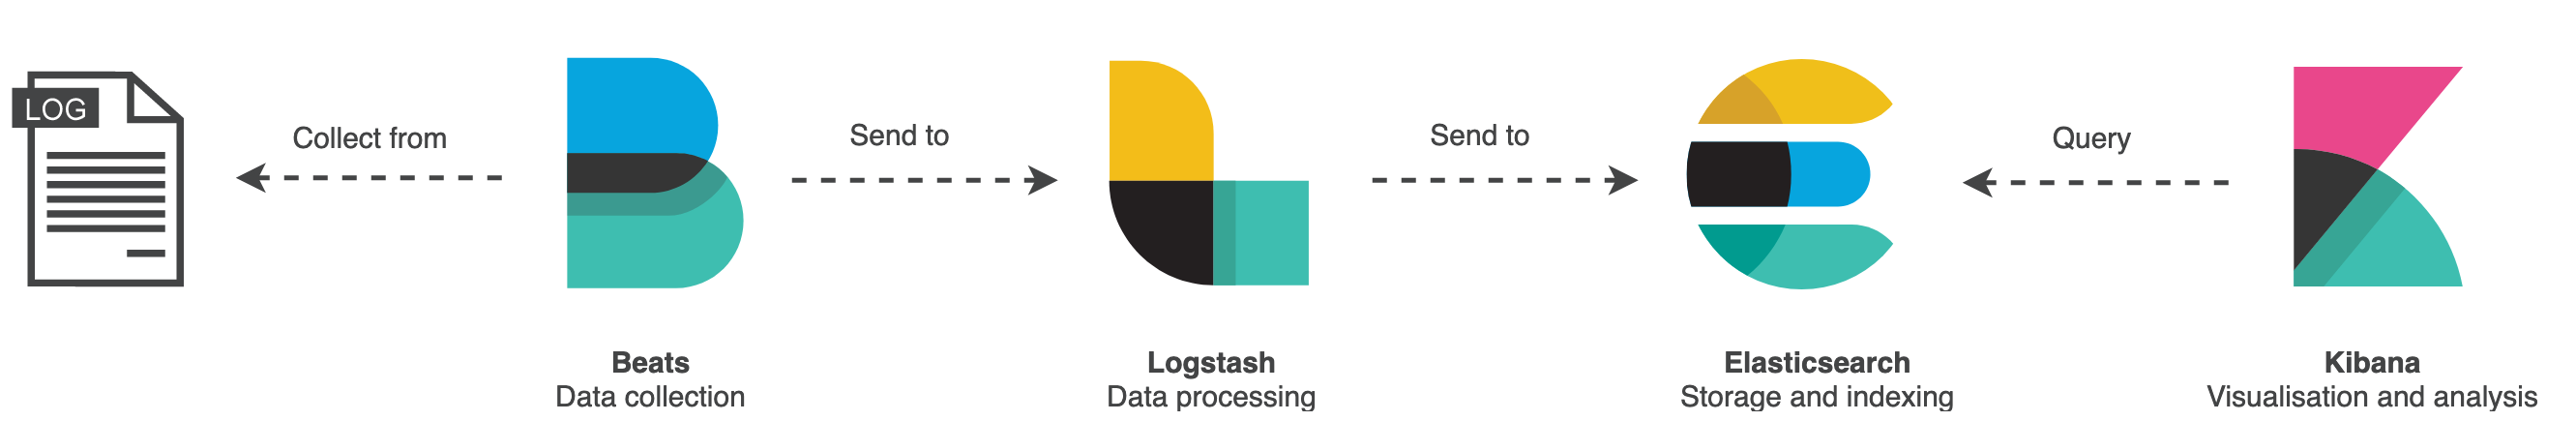
In a few words:
- Filebeat collects data from the log files and sends it to Logststash.
- Logstash enhances the data and sends it to Elasticsearch.
- Elasticsearch stores and indexes the data.
- Kibana displays the data stored in Elasticsearch.
Logs as streams of events #
The Twelve-Factor App methodology, a set of best practices for building software as a service applications, define logs as a stream of aggregated, time-ordered events collected from the output streams of all running processes and backing services which provide visibility into the behavior of a running app. This set of best practices recommends that logs should be treated as event streams:
A twelve-factor app never concerns itself with routing or storage of its output stream. It should not attempt to write to or manage logfiles. Instead, each running process writes its event stream, unbuffered, to
stdout. During local development, the developer will view this stream in the foreground of their terminal to observe the app’s behavior.In staging or production deploys, each process’ stream will be captured by the execution environment, collated together with all other streams from the app, and routed to one or more final destinations for viewing and long-term archival. These archival destinations are not visible to or configurable by the app, and instead are completely managed by the execution environment.
With that in mind, the log event stream for an application can be routed to a file, or watched via realtime tail in a terminal or, preferably, sent to a log indexing and analysis system such as Elastic Stack.
Logging with Logback and SLF4J #
When creating Spring Boot applications that depends on the spring-boot-starter-web artifact,
Logback will be pulled as a transitive dependency and will be used default logging system. Logback is a mature and flexible logging system and that can be used directly or, preferable, with
SLF4J
SLF4J a logging facade or abstraction for various logging frameworks. For logging with SLF4J, we first have to obtain a
Logger instance using
LoggerFactory, as shown below:
public class Example {
    final Logger log = LoggerFactory.getLogger(Example.class);
}
To be less verbose and avoid repeating ourselves in all classes we want to perform logging, we can use
Lombok. It provides the
@Slf4j annotation for generating the logger field for us. The class shown above is is equivalent to the class shown below:
@Slf4j
public class Example {

}
Once we get the logger instance, we can perform logging:
log.trace("Logging at TRACE level");
log.debug("Logging at DEBUG level");
log.info("Logging at INFO level");
log.warn("Logging at WARN level");
log.error("Logging at ERROR level");
Parametrized messages with the {} syntax can also be used. This approach is preferable over string concatenation, as it doesn’t incur the cost of the parameter construction in case the log level is disabled:
log.debug("Found {} results", list.size());
In Spring Boot applications, Logback can be
configured in the logback-spring.xml file, located under the resources folder. In this configuration file, we can take advantage of Spring profiles and the templating features provided by Spring Boot.
Enriching log events with tracing details #
In a microservices architecture, a single business operation might trigger a chain of downstream microservice calls and such interactions between the services can be challenging to debug. To make things easier, we can use Spring Cloud Sleuth to enrich the application logs with tracing details.
Spring Cloud Sleuth is a distributed tracing solution for Spring Cloud and it adds a trace id and a span id to the logs:
- The span represents a basic unit of work, for example sending an HTTP request.
- The trace contains a set of spans, forming a tree-like structure. The trace id will remain the same as one microservice calls the next.
With this information, when visualizing the logs, we’ll be able to get all events for a given trace or span id, providing visibility into the behavior of the chain of interactions between the services.
Once the Spring Cloud Sleuth dependency is added to the classpath, all interactions with the downstream services will be instrumented automatically and the trace and span ids will be added to the SLF4J’s Mapped Diagnostic Context (MDC), which will be included in the logs.
<dependencyManagement>
    <dependencies>
        <dependency>
            <groupId>org.springframework.cloud</groupId>
            <artifactId>spring-cloud-sleuth</artifactId>
            <version>${spring-cloud-sleuth.version}</version>
            <type>pom</type>
            <scope>import</scope>
        </dependency>
    </dependencies>
</dependencyManagement>

<dependencies>
    <dependency>
        <groupId>org.springframework.cloud</groupId>
        <artifactId>spring-cloud-starter-sleuth</artifactId>
    </dependency>
</dependencies>
Logging in JSON format #
Logback, by default, will produce logs in plain text. But as we intend our log events to be indexed in Elasticsearch, which stores JSON documents, it would be a good idea to produce log events in JSON format instead of having to parse plain text log events in Logstash.
To accomplish it, we can use the Logstash Logback Encoder, which provides Logback encoders, layouts, and appenders to log in JSON. The Logstash Logback Encoder was originally written to support output in Logstash’s JSON format, but has evolved into a general-purpose, highly-configurable, structured logging mechanism for JSON and other dataformats.
And, instead of managing log files directly, our microservices could log to the standard output using the ConsoleAppender. As the microservices will run in Docker containers, we can leave the responsibility of writing the log files to Docker. We will see more details about the Docker in the next section.
For a simple and quick configuration, we could use LogstashEncoder, which comes with a
pre-defined set of providers:
<?xml version="1.0" encoding="UTF-8"?>
<configuration>

    <springProperty scope="context" name="application_name" source="spring.application.name"/>

    <appender name="jsonConsoleAppender" class="ch.qos.logback.core.ConsoleAppender">
        <encoder class="net.logstash.logback.encoder.LogstashEncoder"/>
    </appender>

    <root level="INFO">
        <appender-ref ref="jsonConsoleAppender"/>
    </root>

</configuration>
The above configuration will produce the following log output (just bear in mind that the actual output is a single line, but it’s been formatted below for better visualization):
{
   "@timestamp": "2019-06-29T23:01:38.967+01:00",
   "@version": "1",
   "message": "Finding details of post with id 1",
   "logger_name": "com.cassiomolin.logaggregation.post.service.PostService",
   "thread_name": "http-nio-8001-exec-3",
   "level": "INFO",
   "level_value": 20000,
   "application_name": "post-service",
   "traceId": "c52d9ff782fa8f6e",
   "spanId": "c52d9ff782fa8f6e",
   "spanExportable": "false",
   "X-Span-Export": "false",
   "X-B3-SpanId": "c52d9ff782fa8f6e",
   "X-B3-TraceId": "c52d9ff782fa8f6e"
}
This encoder includes the values stored in MDC by default. When Spring Cloud Sleuth is in the classpath, the following properties will added to MDC and will be logged: traceId, spanId, spanExportable, X-Span-Export, X-B3-SpanId and X-B3-TraceId.
If we need more flexibility in the JSON format and in data included in log, we can use LoggingEventCompositeJsonEncoder. The composite encoder has no providers configured by default, so we must add the
providers we want to customize the output:
<?xml version="1.0" encoding="UTF-8"?>
<configuration>

    <springProperty scope="context" name="application_name" source="spring.application.name"/>

    <appender name="jsonConsoleAppender" class="ch.qos.logback.core.ConsoleAppender">
        <encoder class="net.logstash.logback.encoder.LoggingEventCompositeJsonEncoder">
            <providers>
                <timestamp>
                    <timeZone>UTC</timeZone>
                </timestamp>
                <version/>
                <logLevel/>
                <message/>
                <loggerName/>
                <threadName/>
                <context/>
                <pattern>
                    <omitEmptyFields>true</omitEmptyFields>
                    <pattern>
                        {
                            "trace": {
                                "trace_id": "%mdc{X-B3-TraceId}",
                                "span_id": "%mdc{X-B3-SpanId}",
                                "parent_span_id": "%mdc{X-B3-ParentSpanId}",
                                "exportable": "%mdc{X-Span-Export}"
                            }
                        }
                    </pattern>
                </pattern>
                <mdc>
                    <excludeMdcKeyName>traceId</excludeMdcKeyName>
                    <excludeMdcKeyName>spanId</excludeMdcKeyName>
                    <excludeMdcKeyName>parentId</excludeMdcKeyName>
                    <excludeMdcKeyName>spanExportable</excludeMdcKeyName>
                    <excludeMdcKeyName>X-B3-TraceId</excludeMdcKeyName>
                    <excludeMdcKeyName>X-B3-SpanId</excludeMdcKeyName>
                    <excludeMdcKeyName>X-B3-ParentSpanId</excludeMdcKeyName>
                    <excludeMdcKeyName>X-Span-Export</excludeMdcKeyName>
                </mdc>
                <stackTrace/>
            </providers>
        </encoder>
    </appender>

    <root level="INFO">
        <appender-ref ref="jsonConsoleAppender"/>
    </root>

</configuration>
Find below a sample of the log output for the above configuration. Again, the actual output is a single line, but it’s been formatted for better visualization:
{
   "@timestamp": "2019-06-29T22:01:38.967Z",
   "@version": "1",
   "level": "INFO",
   "message": "Finding details of post with id 1",
   "logger_name": "com.cassiomolin.logaggregation.post.service.PostService",
   "thread_name": "http-nio-8001-exec-3",
   "application_name": "post-service",
   "trace": {
      "trace_id": "c52d9ff782fa8f6e",
      "span_id": "c52d9ff782fa8f6e",
      "exportable": "false"
   }
}
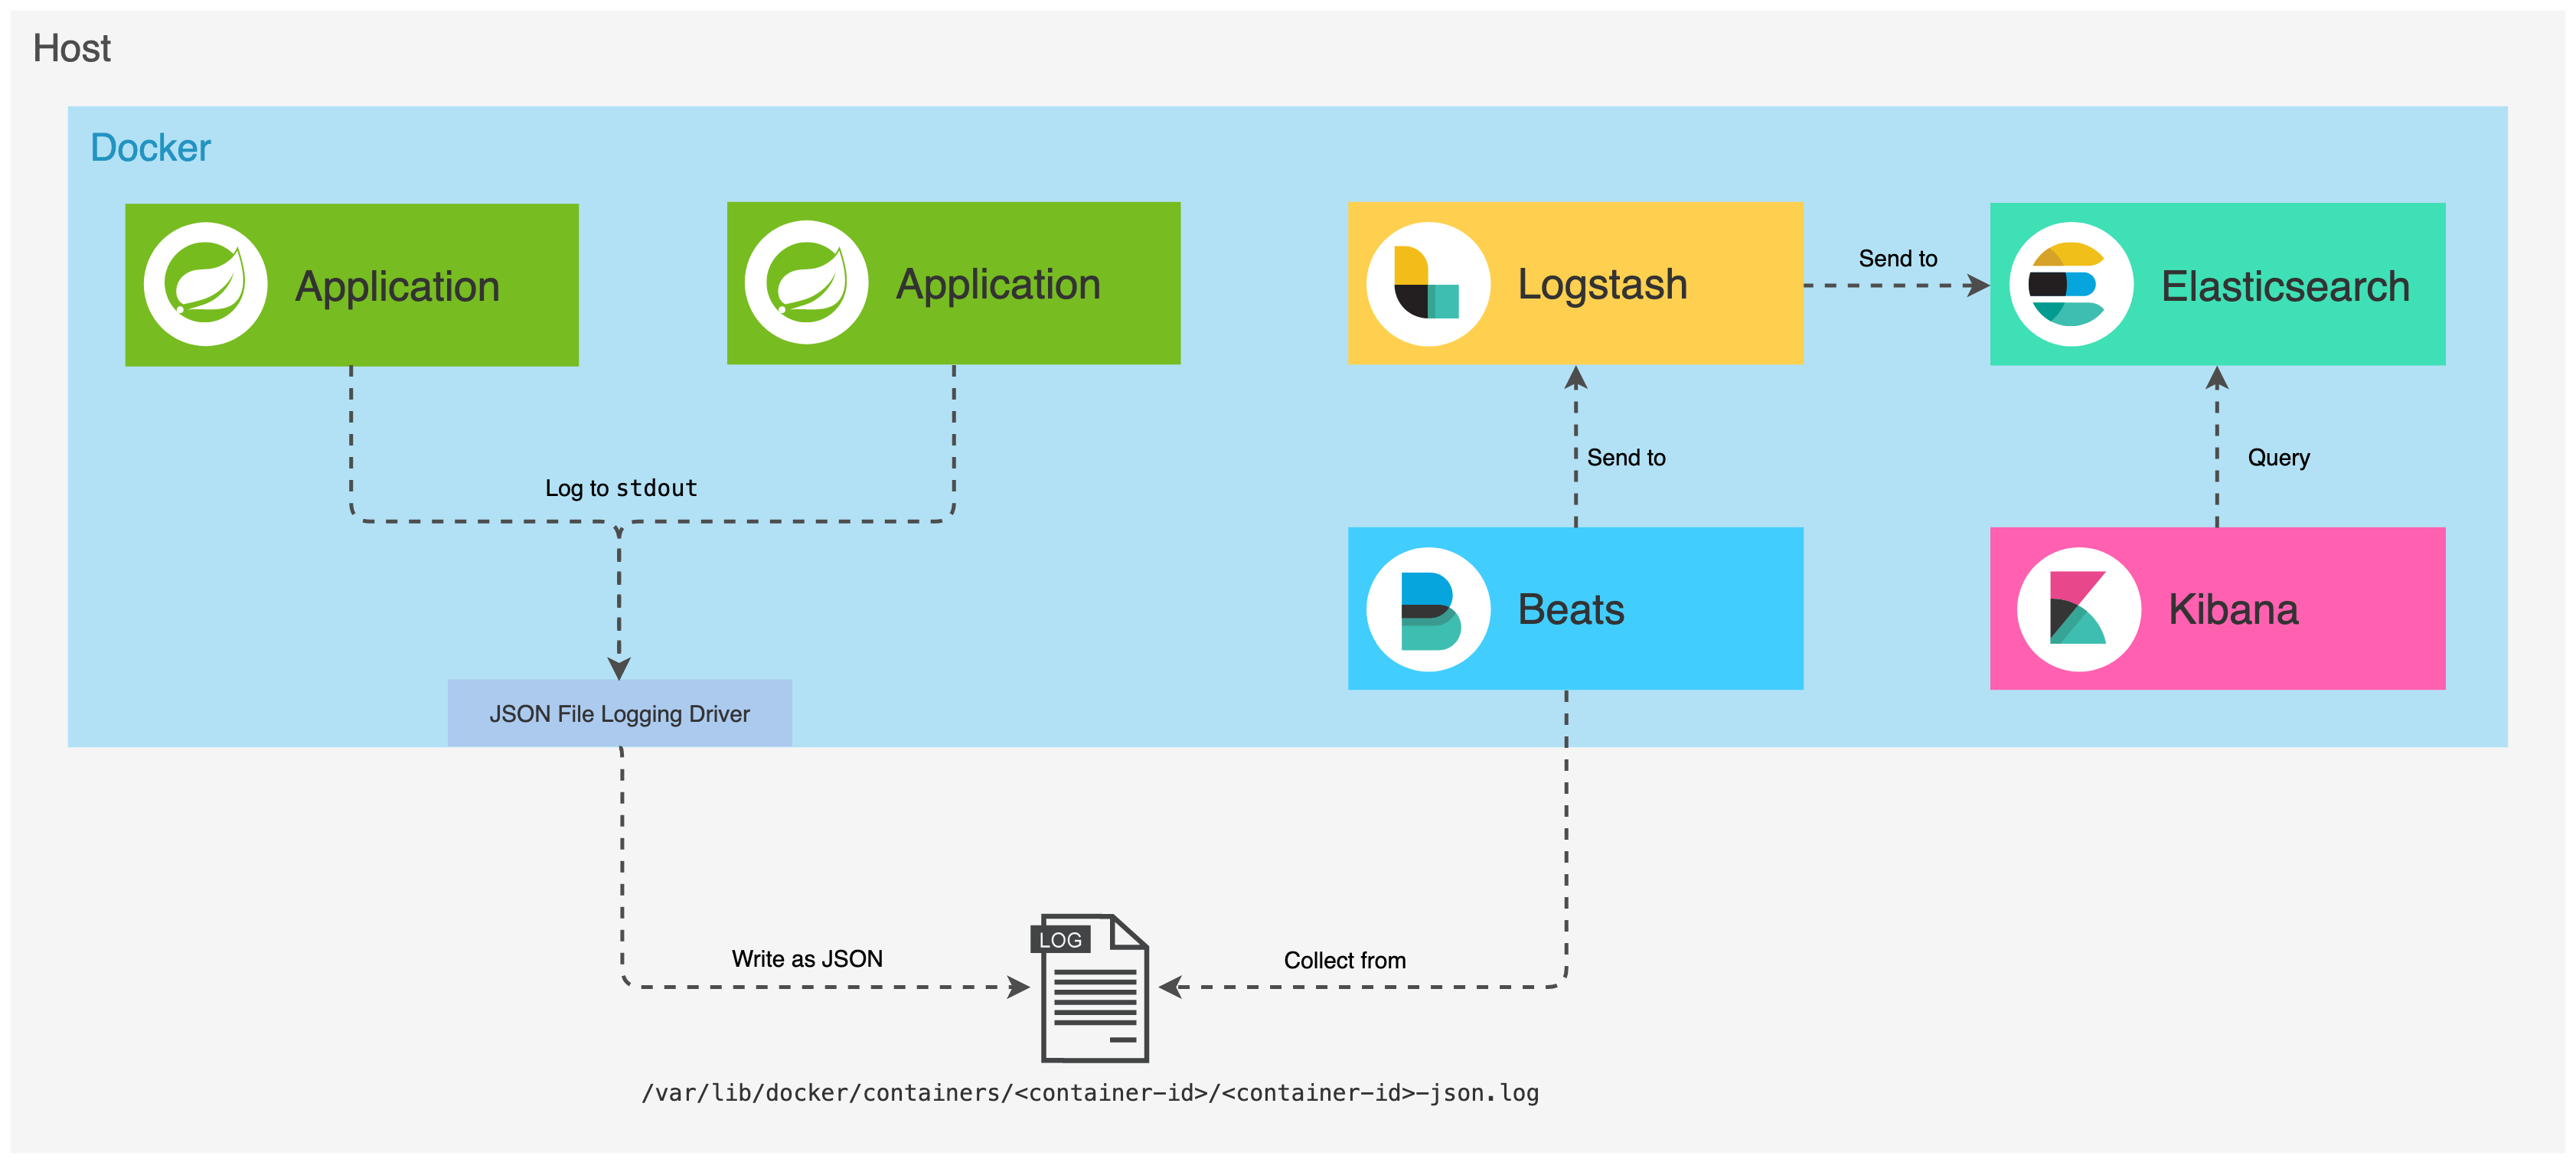
Running on Docker containers #
We’ll run Elastic Stack applications along with our Spring Boot microservices in Docker containers:
As we will have multiple containers, we will use Docker Compose to manage them. With Compose, application’s services are configured in a YAML file. Then, with a single command, we create and start all the services from our configuration. Pretty cool stuff!
Have a look at how the services are defined and configured in the
docker-compose.yml. What’s important to highlight is the fact that labels have been added to some services. Labels are simply metadata that only have meaning for who’s using them. Let’s have a quick looks at the labels that have been defined for the services:
collect_logs_with_filebeat: When set totrue, indicates that Filebeat should collect the logs produced by the Docker container.decode_log_event_to_json_object: Filebeat collects and stores the log event as a string in themessageproperty of a JSON document. If the events are logged as JSON (which is the case when using the appenders defined above), the value of this label can be set totrueto indicate that Filebeat should decode the JSON string stored in themessageproperty to an actual JSON object.
Both post and comment services will produce logs to the standard output (stdout). By default, Docker captures the standard output (and standard error) of all your containers, and writes them to files in JSON format, using the json-file driver. The logs files are stored in the /var/lib/docker/containers directory and each log file contains information about only one container.
When applications run on containers, they become moving targets to the monitoring system. So we’ll use the
autodiscover feature from Filebeat, which allows it to track the containers and adapt settings as changes happen. By defining configuration templates, the autodiscover subsystem can monitor services as they start running. So, in the
filebeat.docker.yml file, Filebeat is configured to:
- Autodiscover the Docker containers that have the label
collect_logs_with_filebeatset totrue - Collect logs from the containers that have been discovered
- Decode the
messagefield to a JSON object when the log event was produced by a container that have the labeldecode_log_event_to_json_objectset totrue - Send the log events to Logstash which runs on the port
5044
filebeat.autodiscover:
  providers:
    - type: docker
      labels.dedot: true
      templates:
        - condition:
            contains:
              container.labels.collect_logs_with_filebeat: "true"
          config:
            - type: container
              format: docker
              paths:
                - "/var/lib/docker/containers/${data.docker.container.id}/*.log"
              processors:
                - decode_json_fields:
                    when.equals:
                      docker.container.labels.decode_log_event_to_json_object: "true"
                    fields: ["message"]
                    target: ""
                    overwrite_keys: true

output.logstash:
  hosts: "logstash:5044"
The above configuration uses a single processor. If we need, we could add more processors, which will be chained and executed in the order they are defined in the configuration file. Each processor receives an event, applies a defined action to the event, and the processed event is the input of the next processor until the end of the chain.
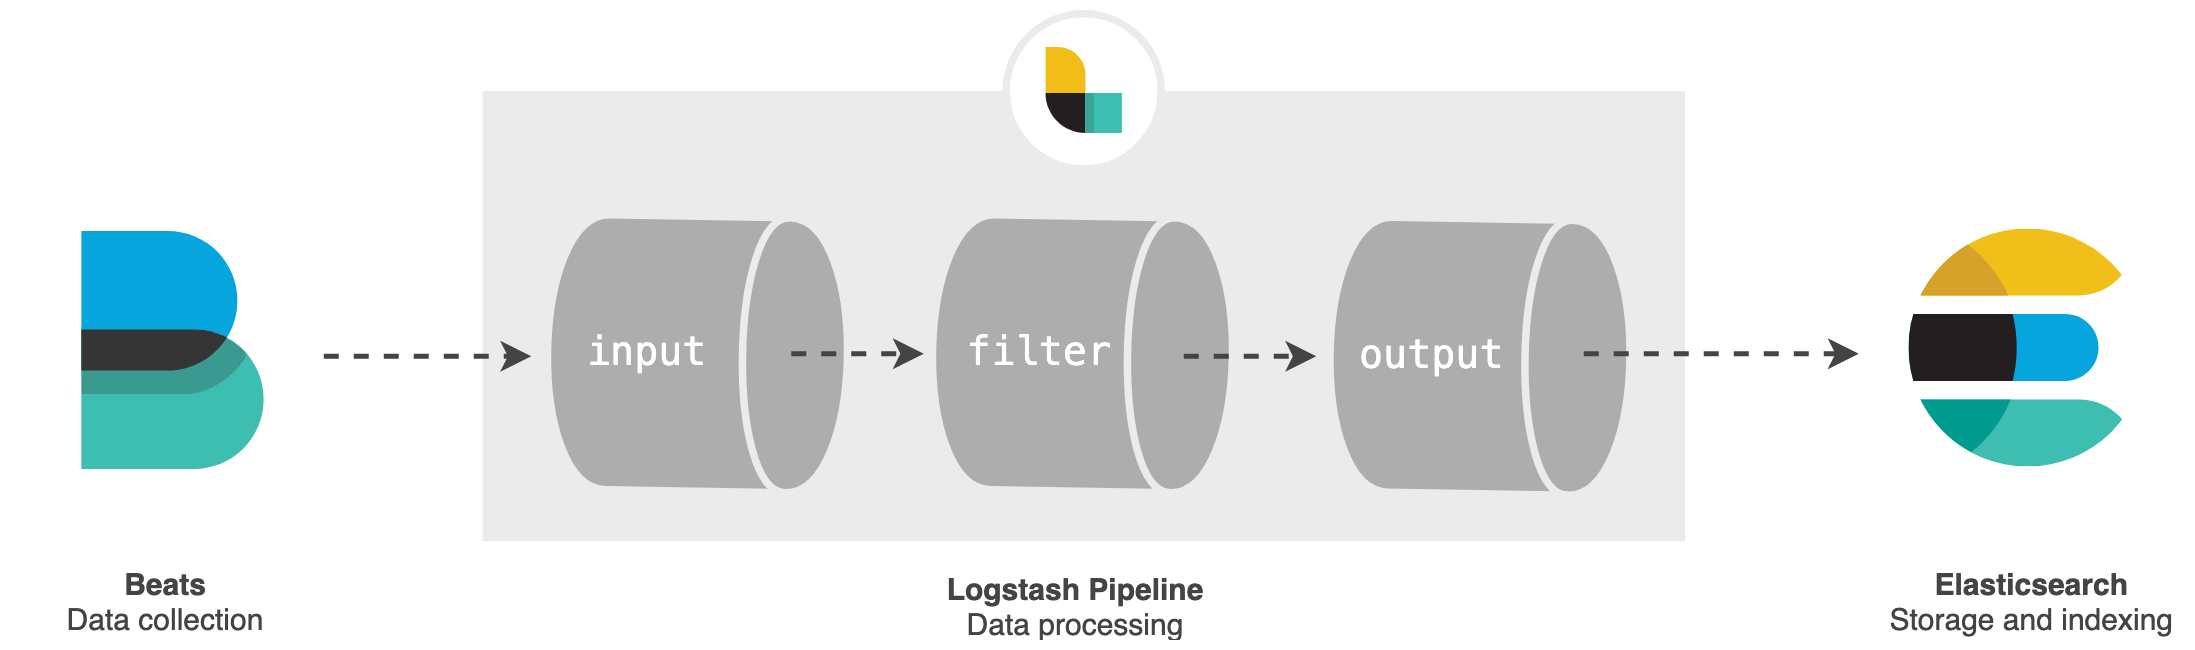
Once the log event is collected and processed by Filebeat, it is sent to Logstash, which provides a rich set of plugins for further processing the events.
The Logstash pipeline has two required elements, input and output, and one optional element, filter. The
input plugins consume data from a source, the
filter plugins modify the data as we specify, and the
output plugins write the data to a destination.
In the
logstash.conf file, Logstash is configured to:
- Receive events coming from Beats in the port
5044 - Process the events by adding the tag
logstash_filter_applied - Send the processed events to Elasticsearch which runs on the port
9200
input {
  beats {
    port => 5044
  }
}

filter {
  mutate {
    add_tag => [ "logstash_filter_applied" ]
  }
}

output {
  elasticsearch {
    hosts => "elasticsearch:9200"
  }
}
Elasticsearch will store and index the log events and, finally, we will be able to visualize the logs in Kibana, which exposes a UI in the port 5601.
Example #
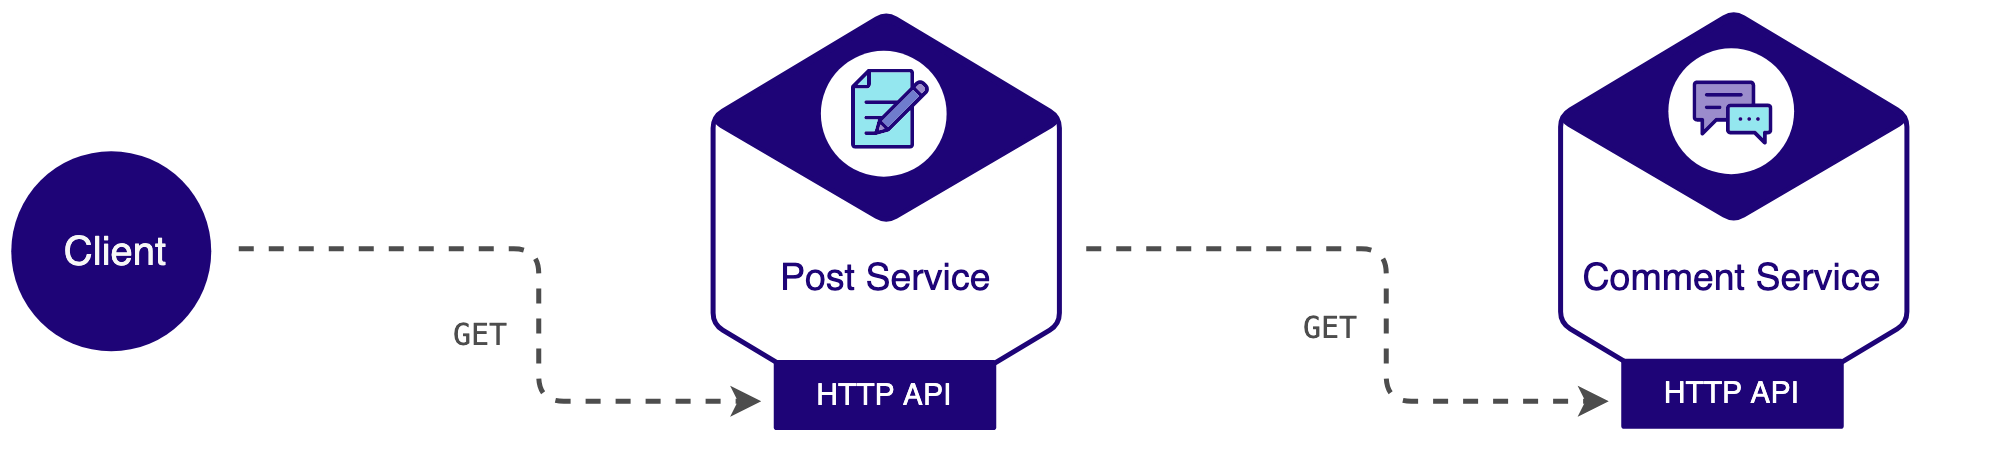
For this example, let’s consider we are creating a blog engine and we have the following microservices:
- Post service: Manages details related to posts.
- Comment service: Manages details related to the comments of each post.
Each microservice is a Spring Boot application, exposing a HTTP API. As we intend to focus on log aggregation, let’s keep it simple when it comes to the services architecture: One service will simply invoke the other service directly.
And, for demonstration purposes, all data handled by the services is stored in memory and only GET requests are supported. When a representation of post is requested, the post service will perform a GET request to the comment service to get a representation of the comments for that post. The post service will aggregate the results and return a representation of the post with comments to the client.
Let’s see how to build the source code, spin up the Docker containers, produce some log data and then visualize the logs in Kibana.
Before starting, ensure you at least Java 11, Maven 3.x and Docker set up. Then clone the repository from GitHub:
git clone https://github.com/cassiomolin/log-aggregation-spring-boot-elastic-stack.git
Building the applications and creating Docker images #
Both post and comment services use the
dockerfile-maven plugin from Spotify to make the Docker build process integrate with the Maven build process. So when we build a Spring Boot artifact, we’ll also build a Docker image for it. For more details, check the Dockerfile and the pox.xml of each service.
To build the Spring Boot applications and their Docker images:
Change to the
comment-servicefolder:cd comment-serviceBuild the application and create a Docker image:
mvn clean installChange back to the parent folder:
cd ..Change to the
post-servicefolder:cd post-serviceBuild the application and create a Docker image:
mvn clean installChange back to the parent folder:
cd ..
Spinning up the containers #
In the root folder of our project, where the docker-compose.yml resides, spin up the Docker containers running docker-compose up.
Visualizing logs in Kibana #
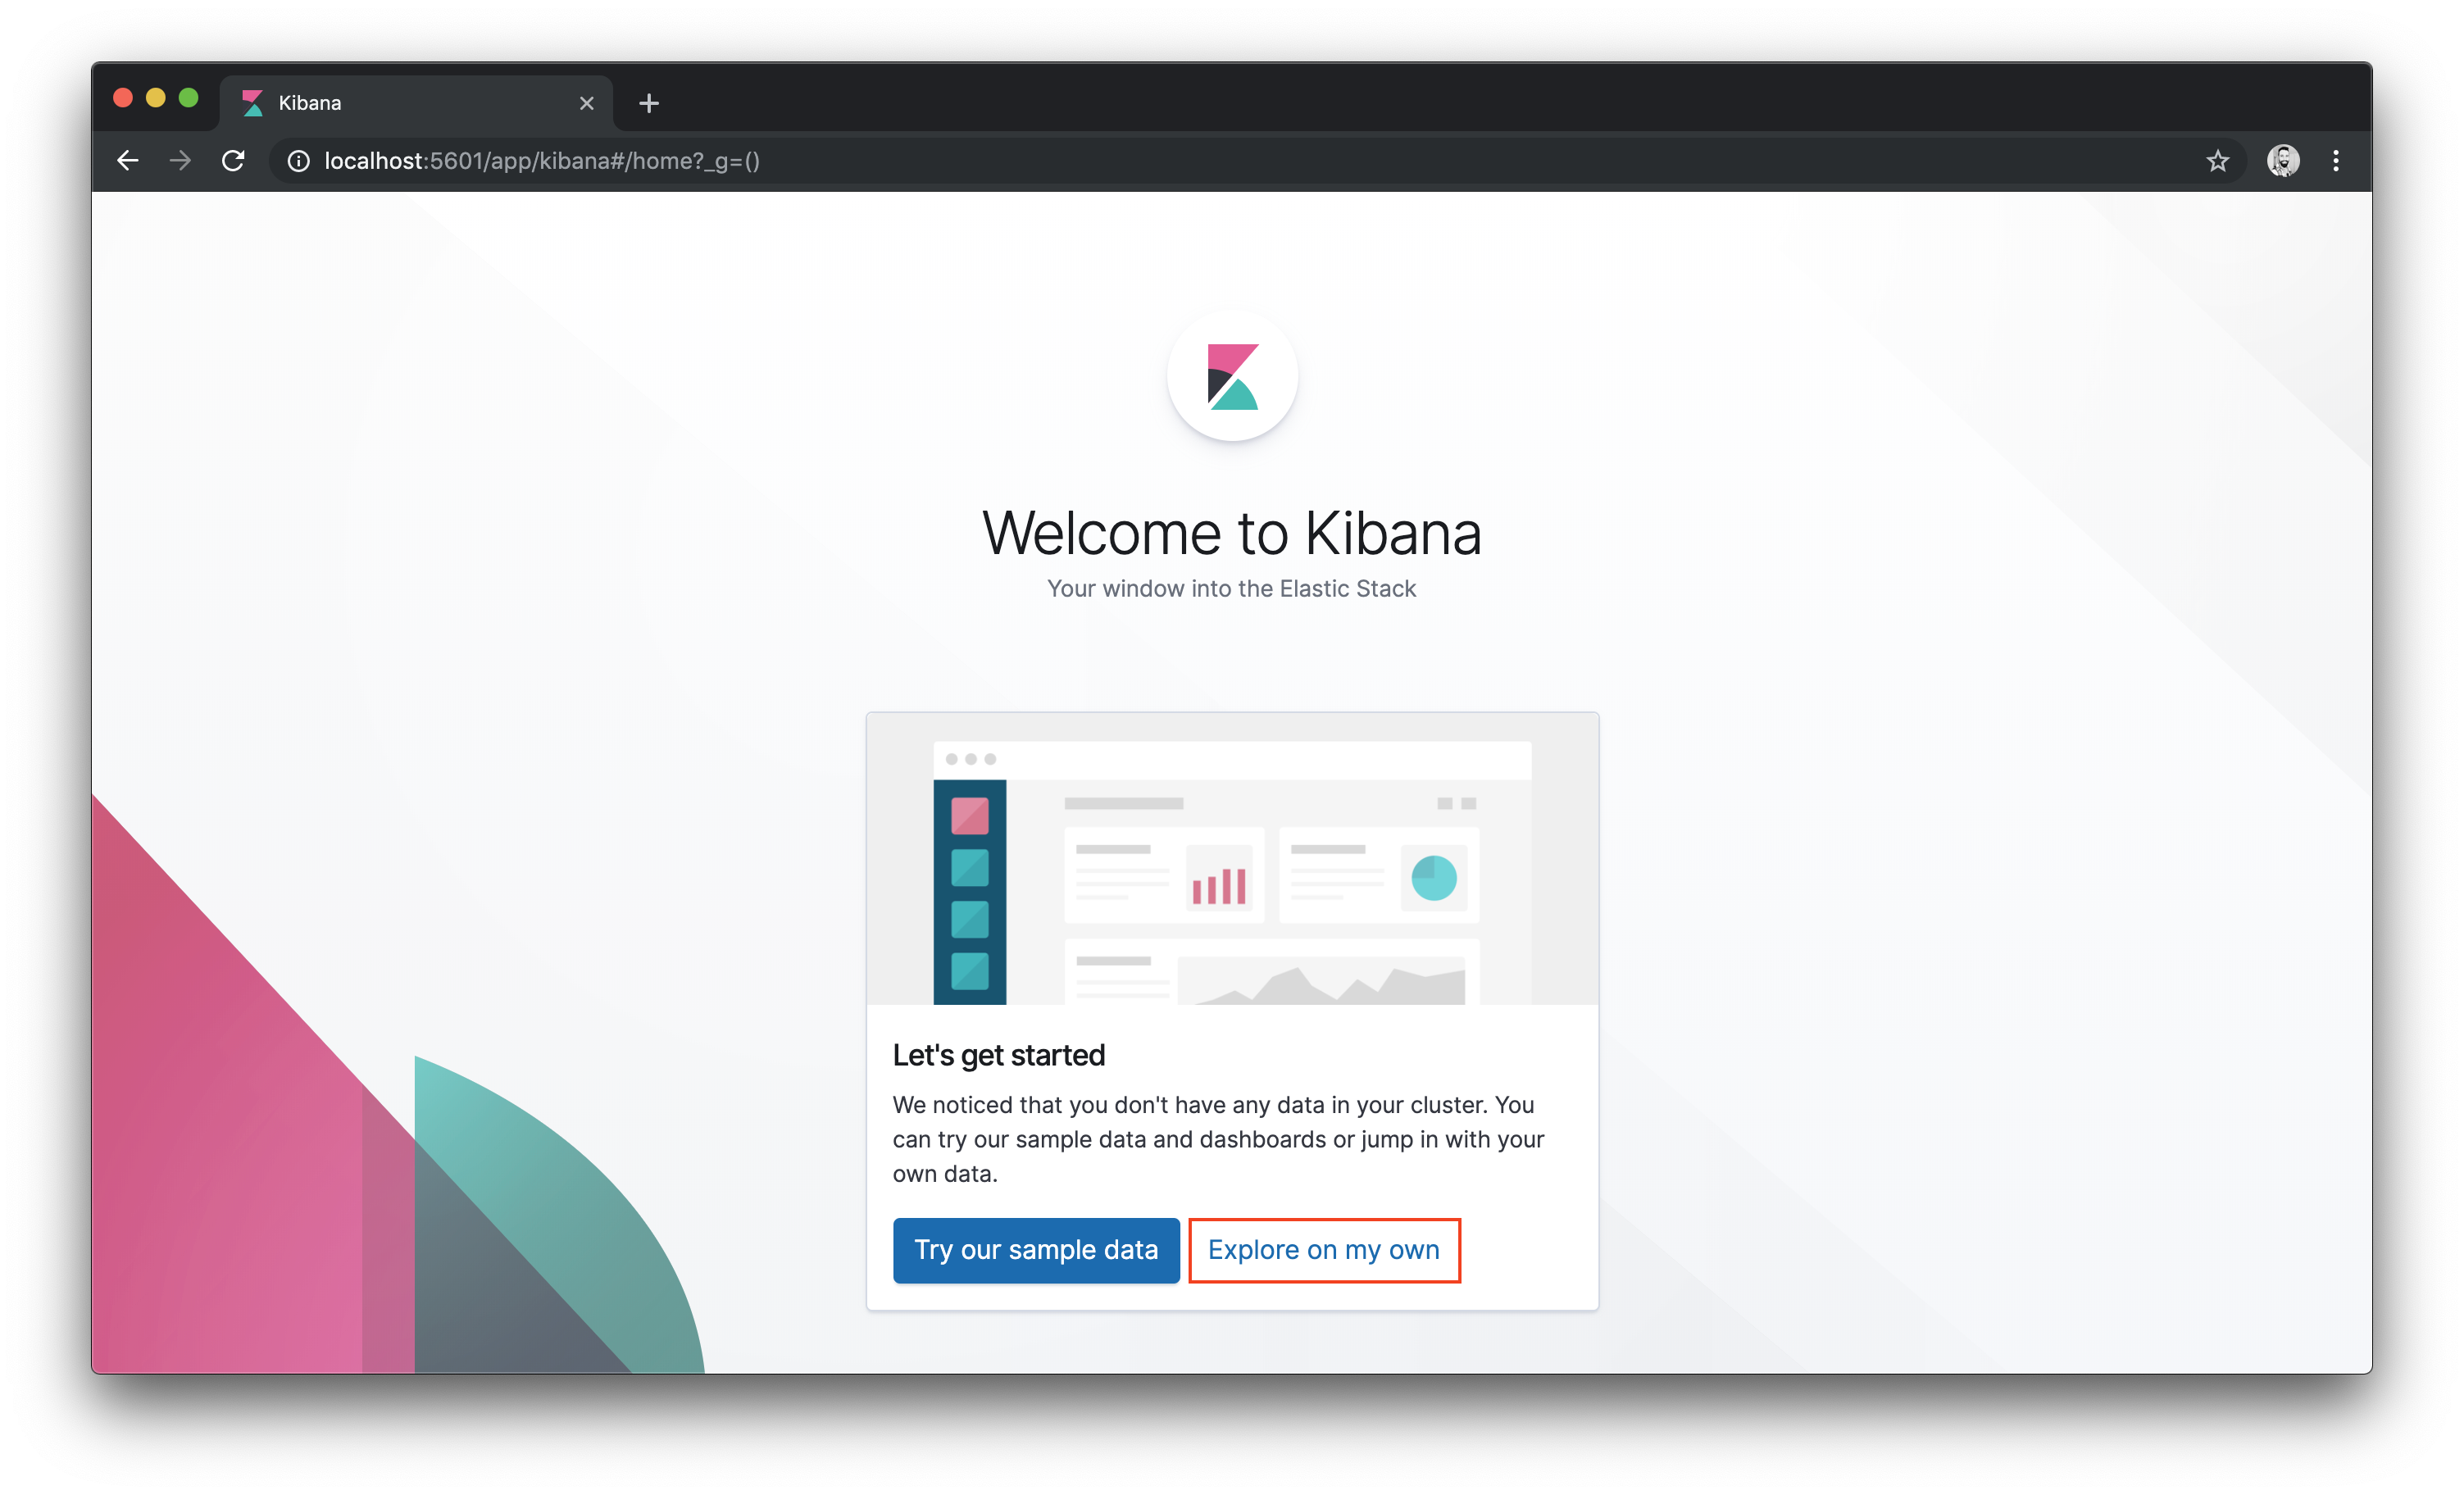
Open Kibana in your favourite browser:
http://localhost:5601. When attempting to to access Kibana while it’s starting, a message saying that Kibana is not ready yet will be displayed in the browser. Enhance your calm, give it a minute or two and then you are good to go.In the first time you access Kibana, a welcome page will be displayed. Kibana comes with sample data in case we want to play with it. To explore the data generate by our applications, click the Explore on my own link.
- On the left hand side, click the Discover icon.
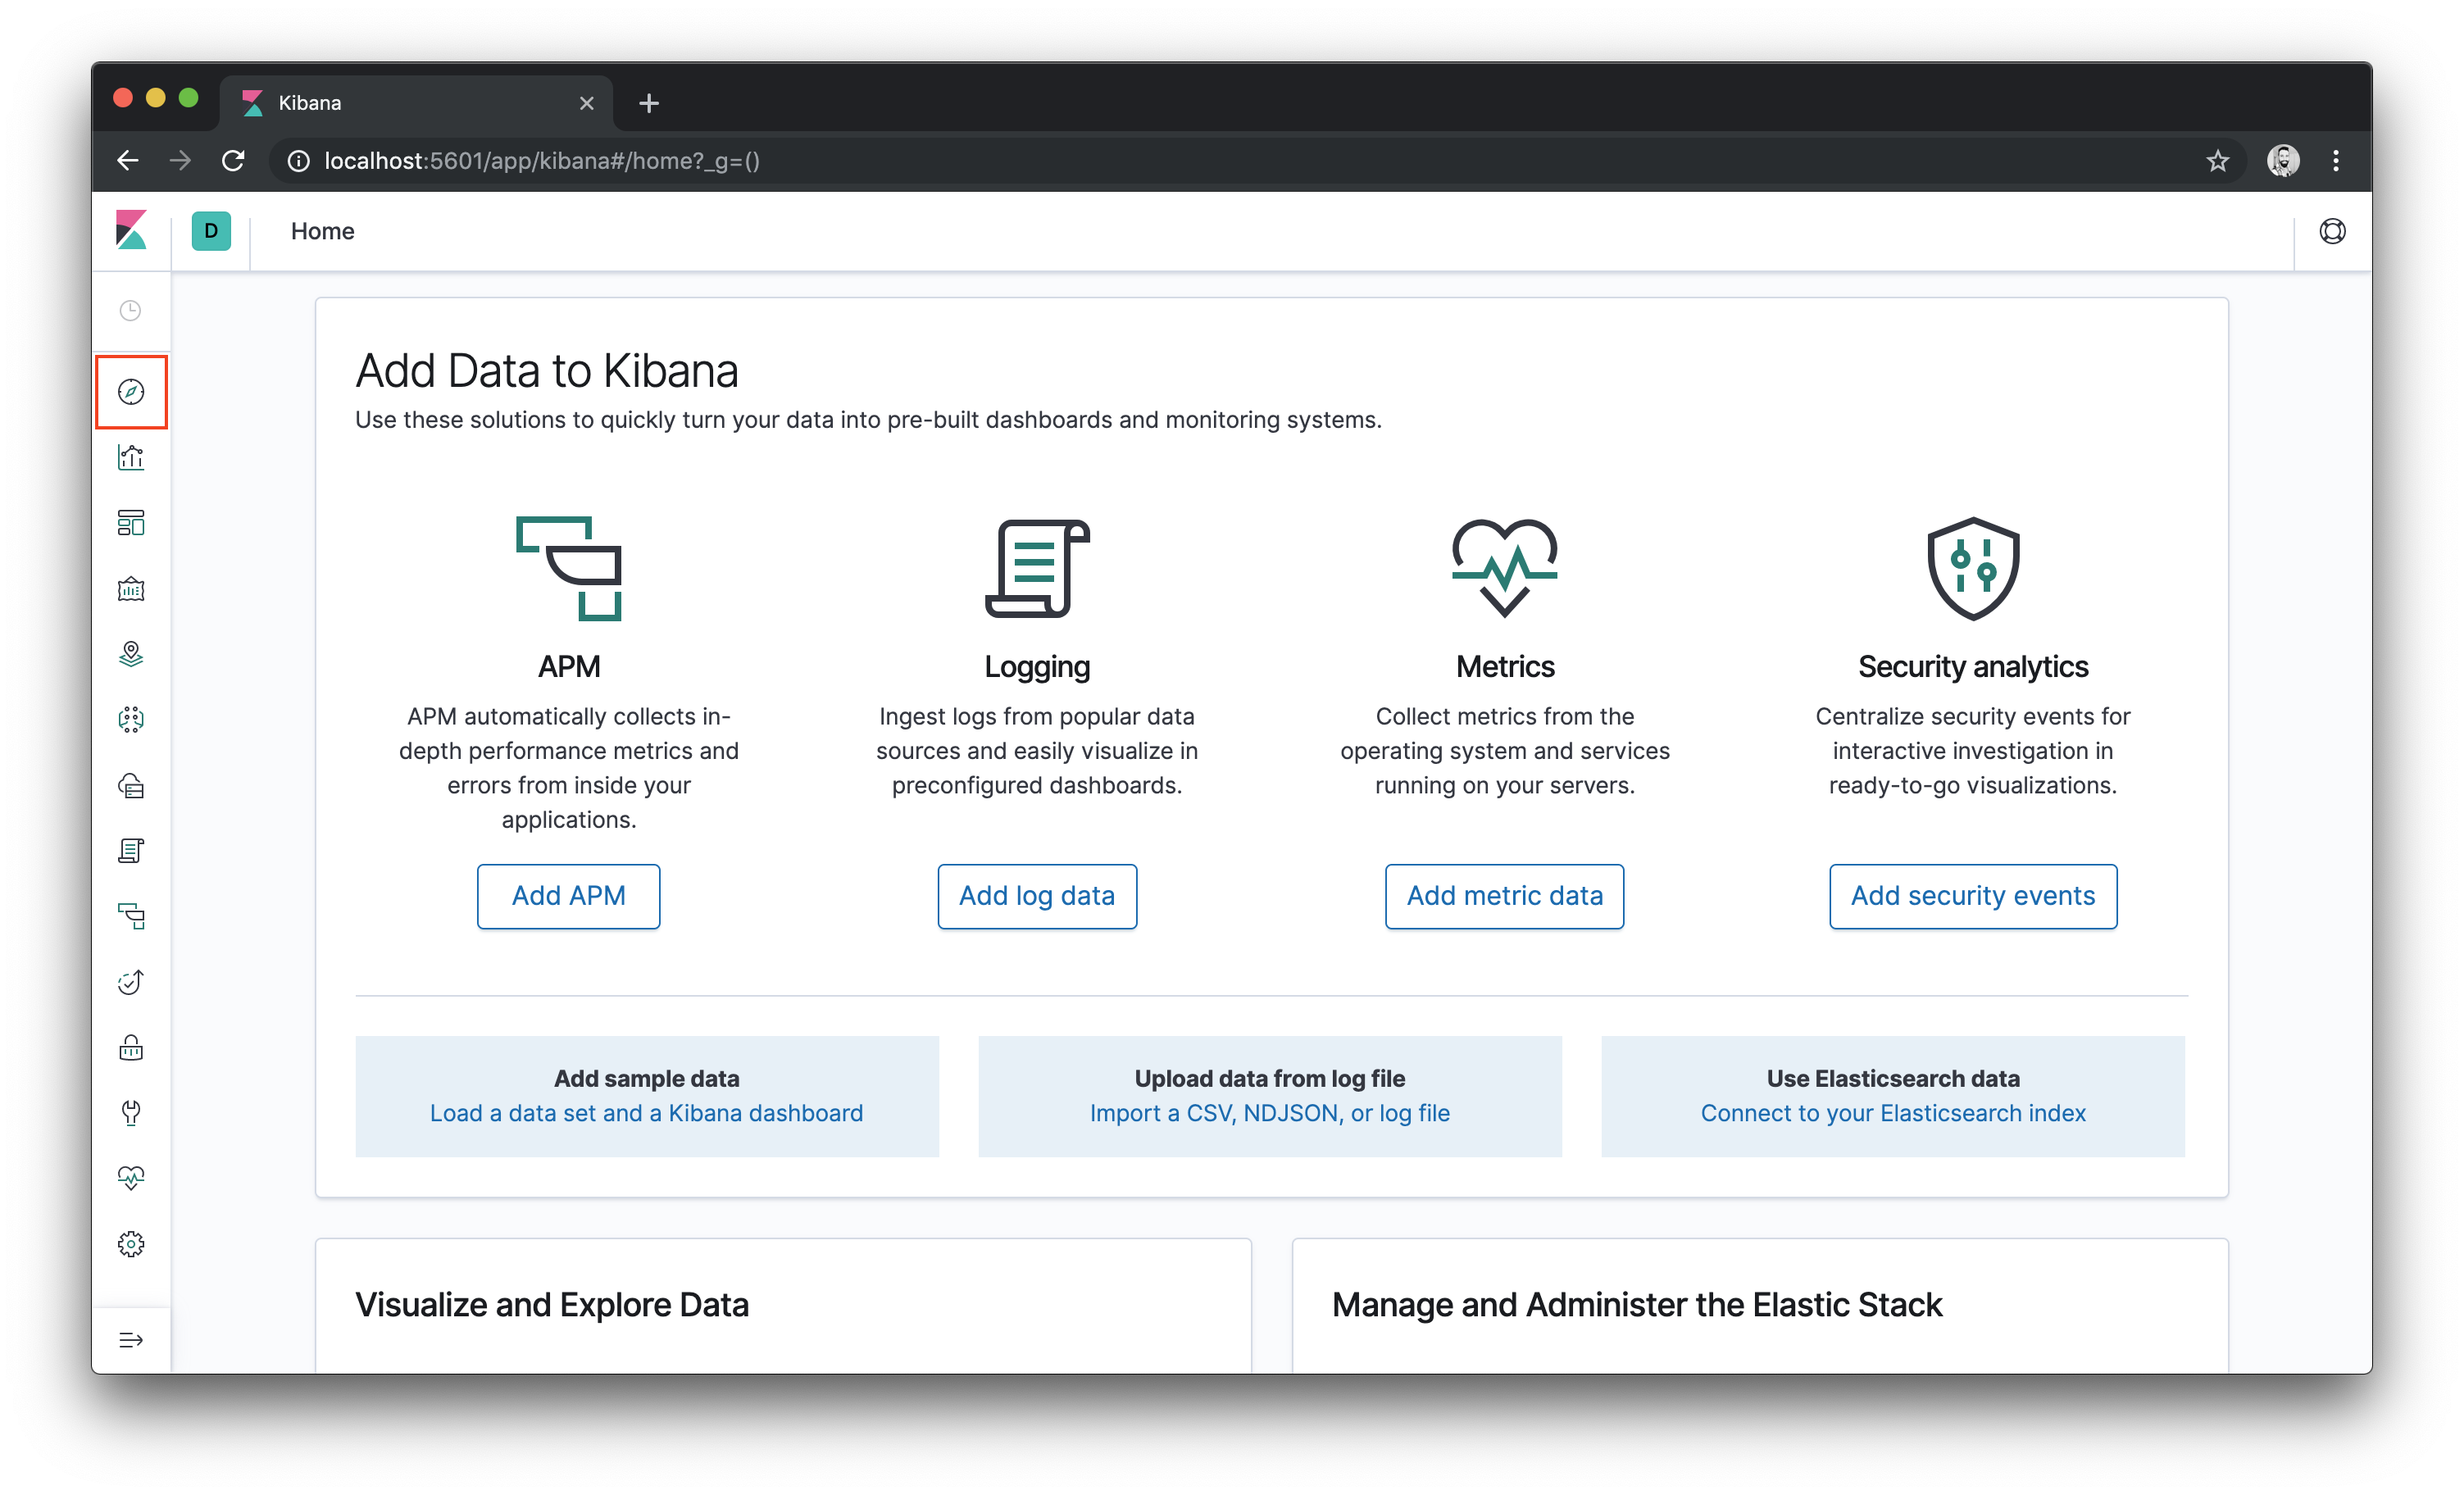
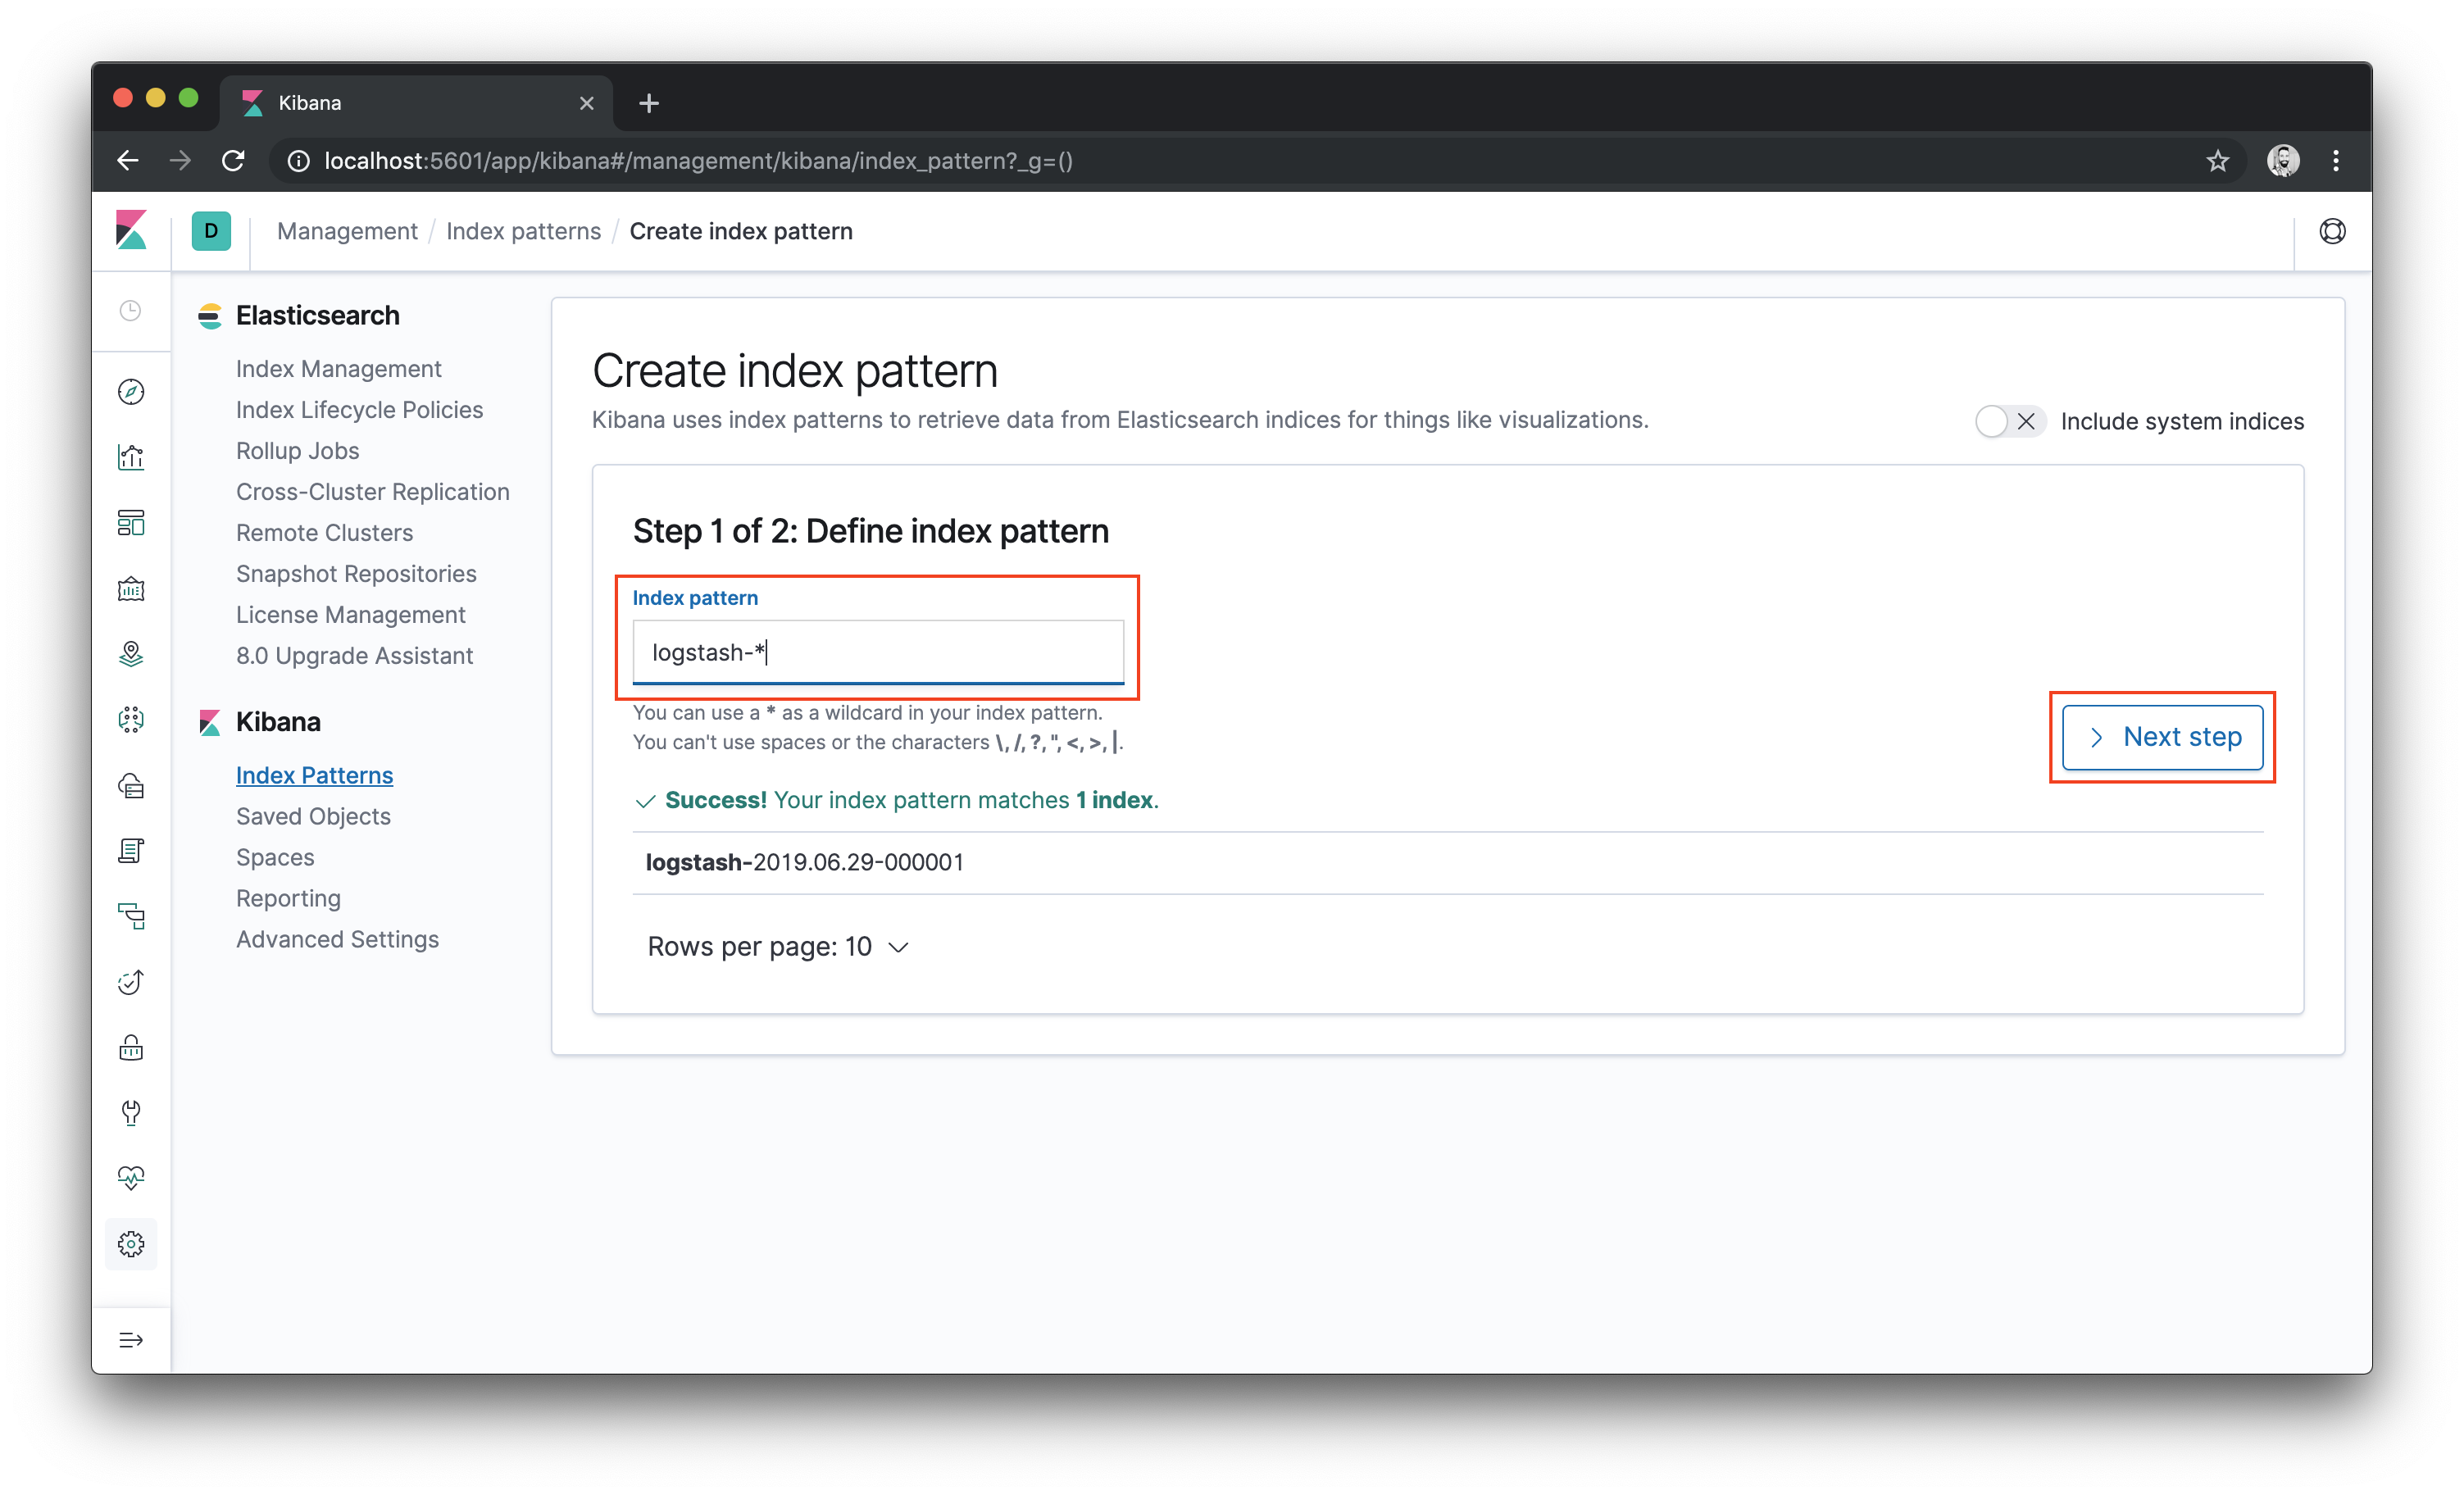
Kibana uses index patterns for retrieving data from Elasticsearch. As it’s the first time we are using Kibana, we must create an index pattern to explore our data. We should see an index that has been created by Logstash. So create a pattern for matching the Logstash indexes using
logstash-*and then click the Next step button.Kibana uses index patterns for retrieving data from Elasticsearch. So, to get started, you must create an index pattern. In this page, you should see an index that has been created by Logstash. To create a pattern for matching this index, enter
logstash-*and then click the Next step button.
- Then pick a field for filtering the data by time. Choose
@timestampand click the Create index pattern button.
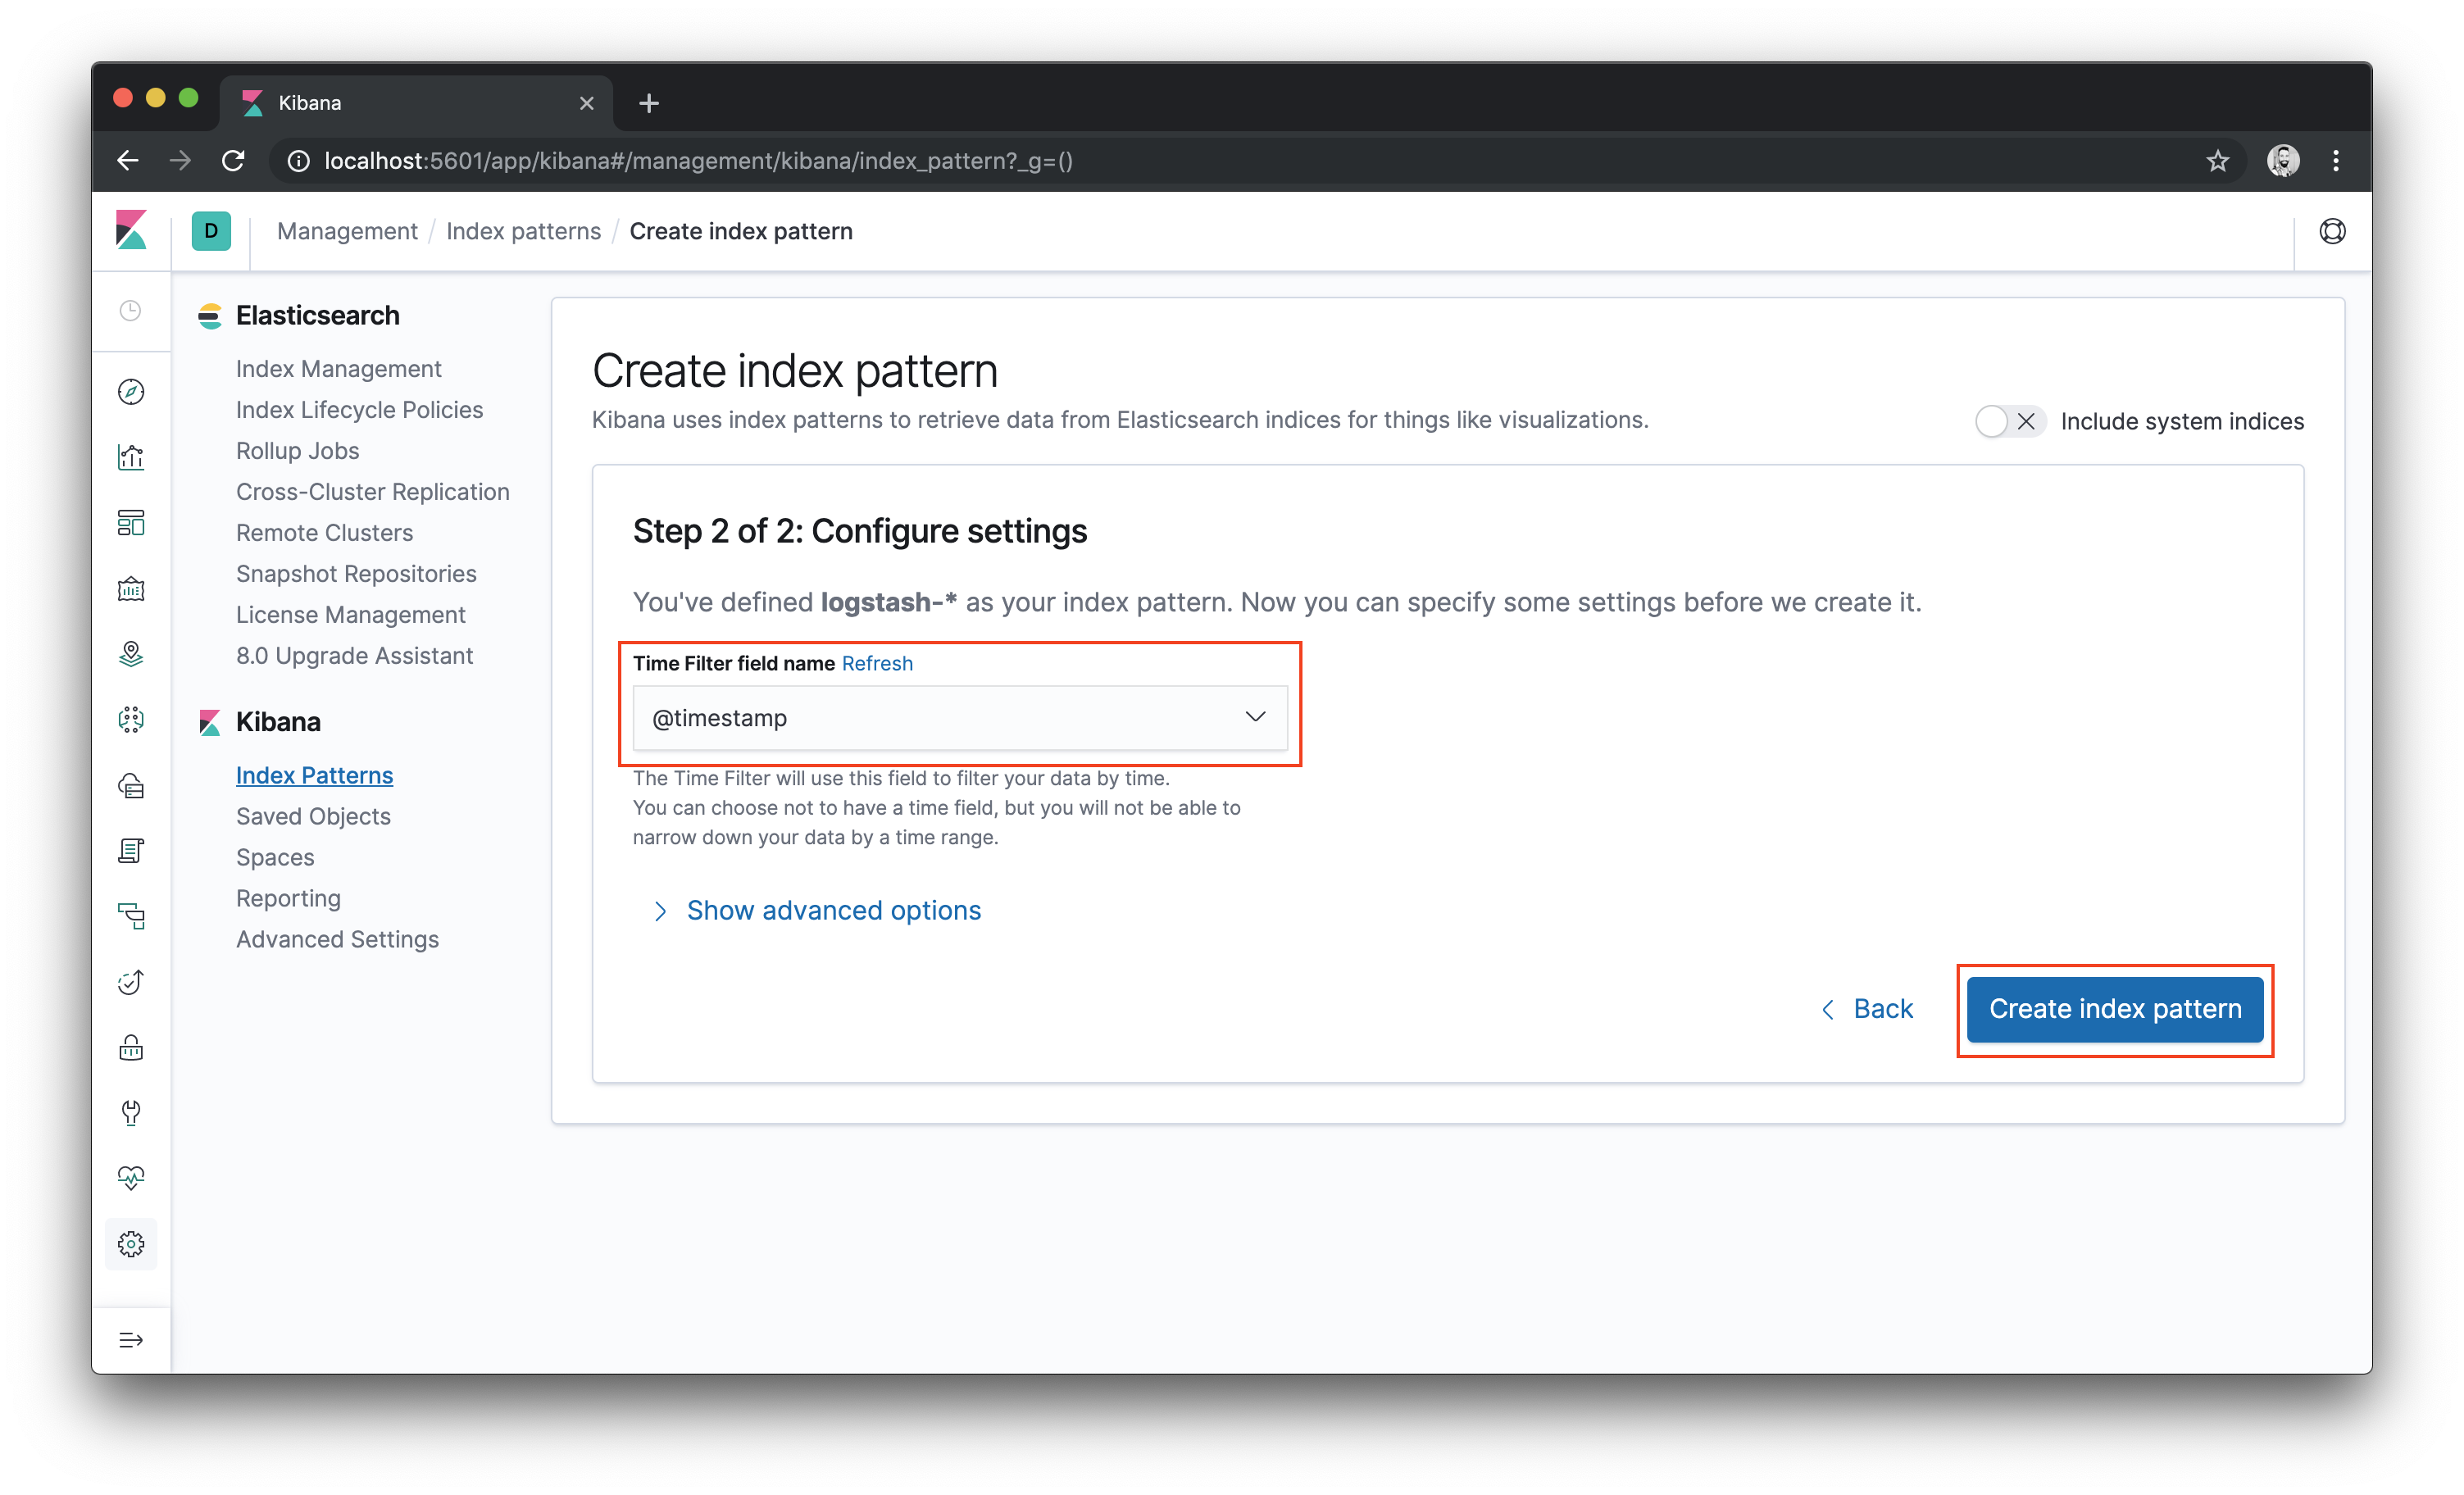
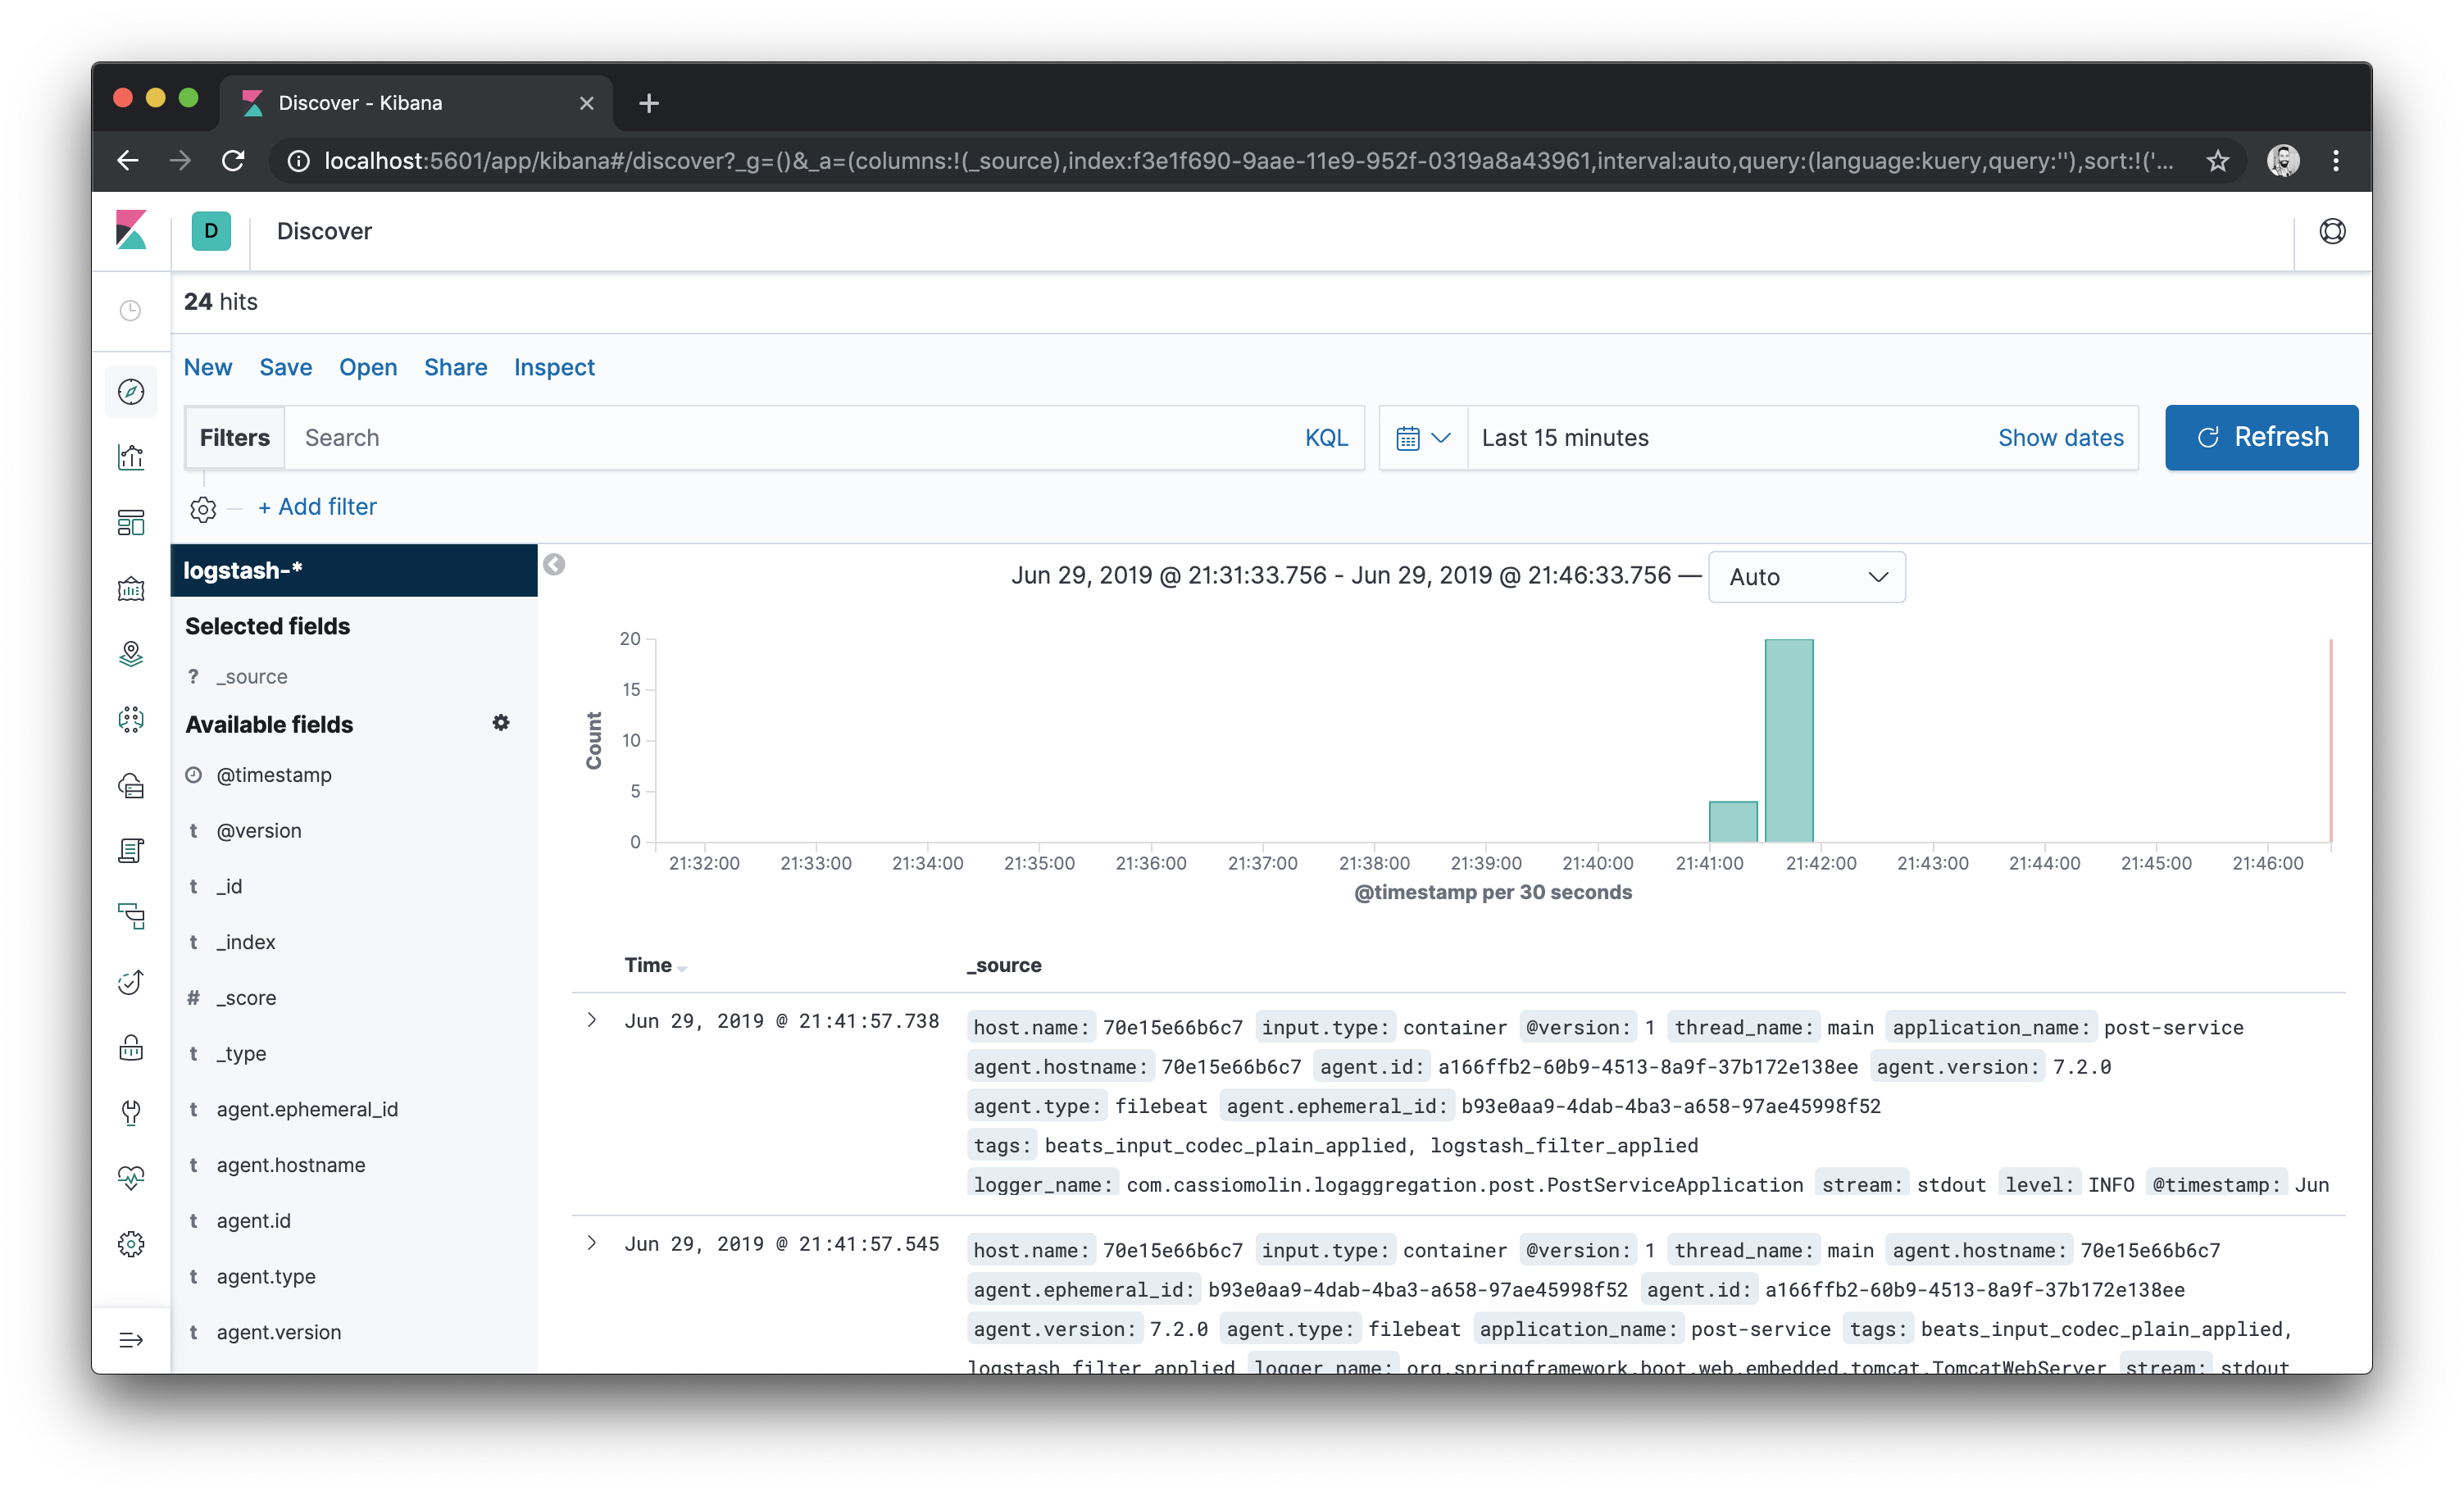
- The index pattern will be created. Click again in the Discover icon and the log events of both post and comment services start up will be shown:
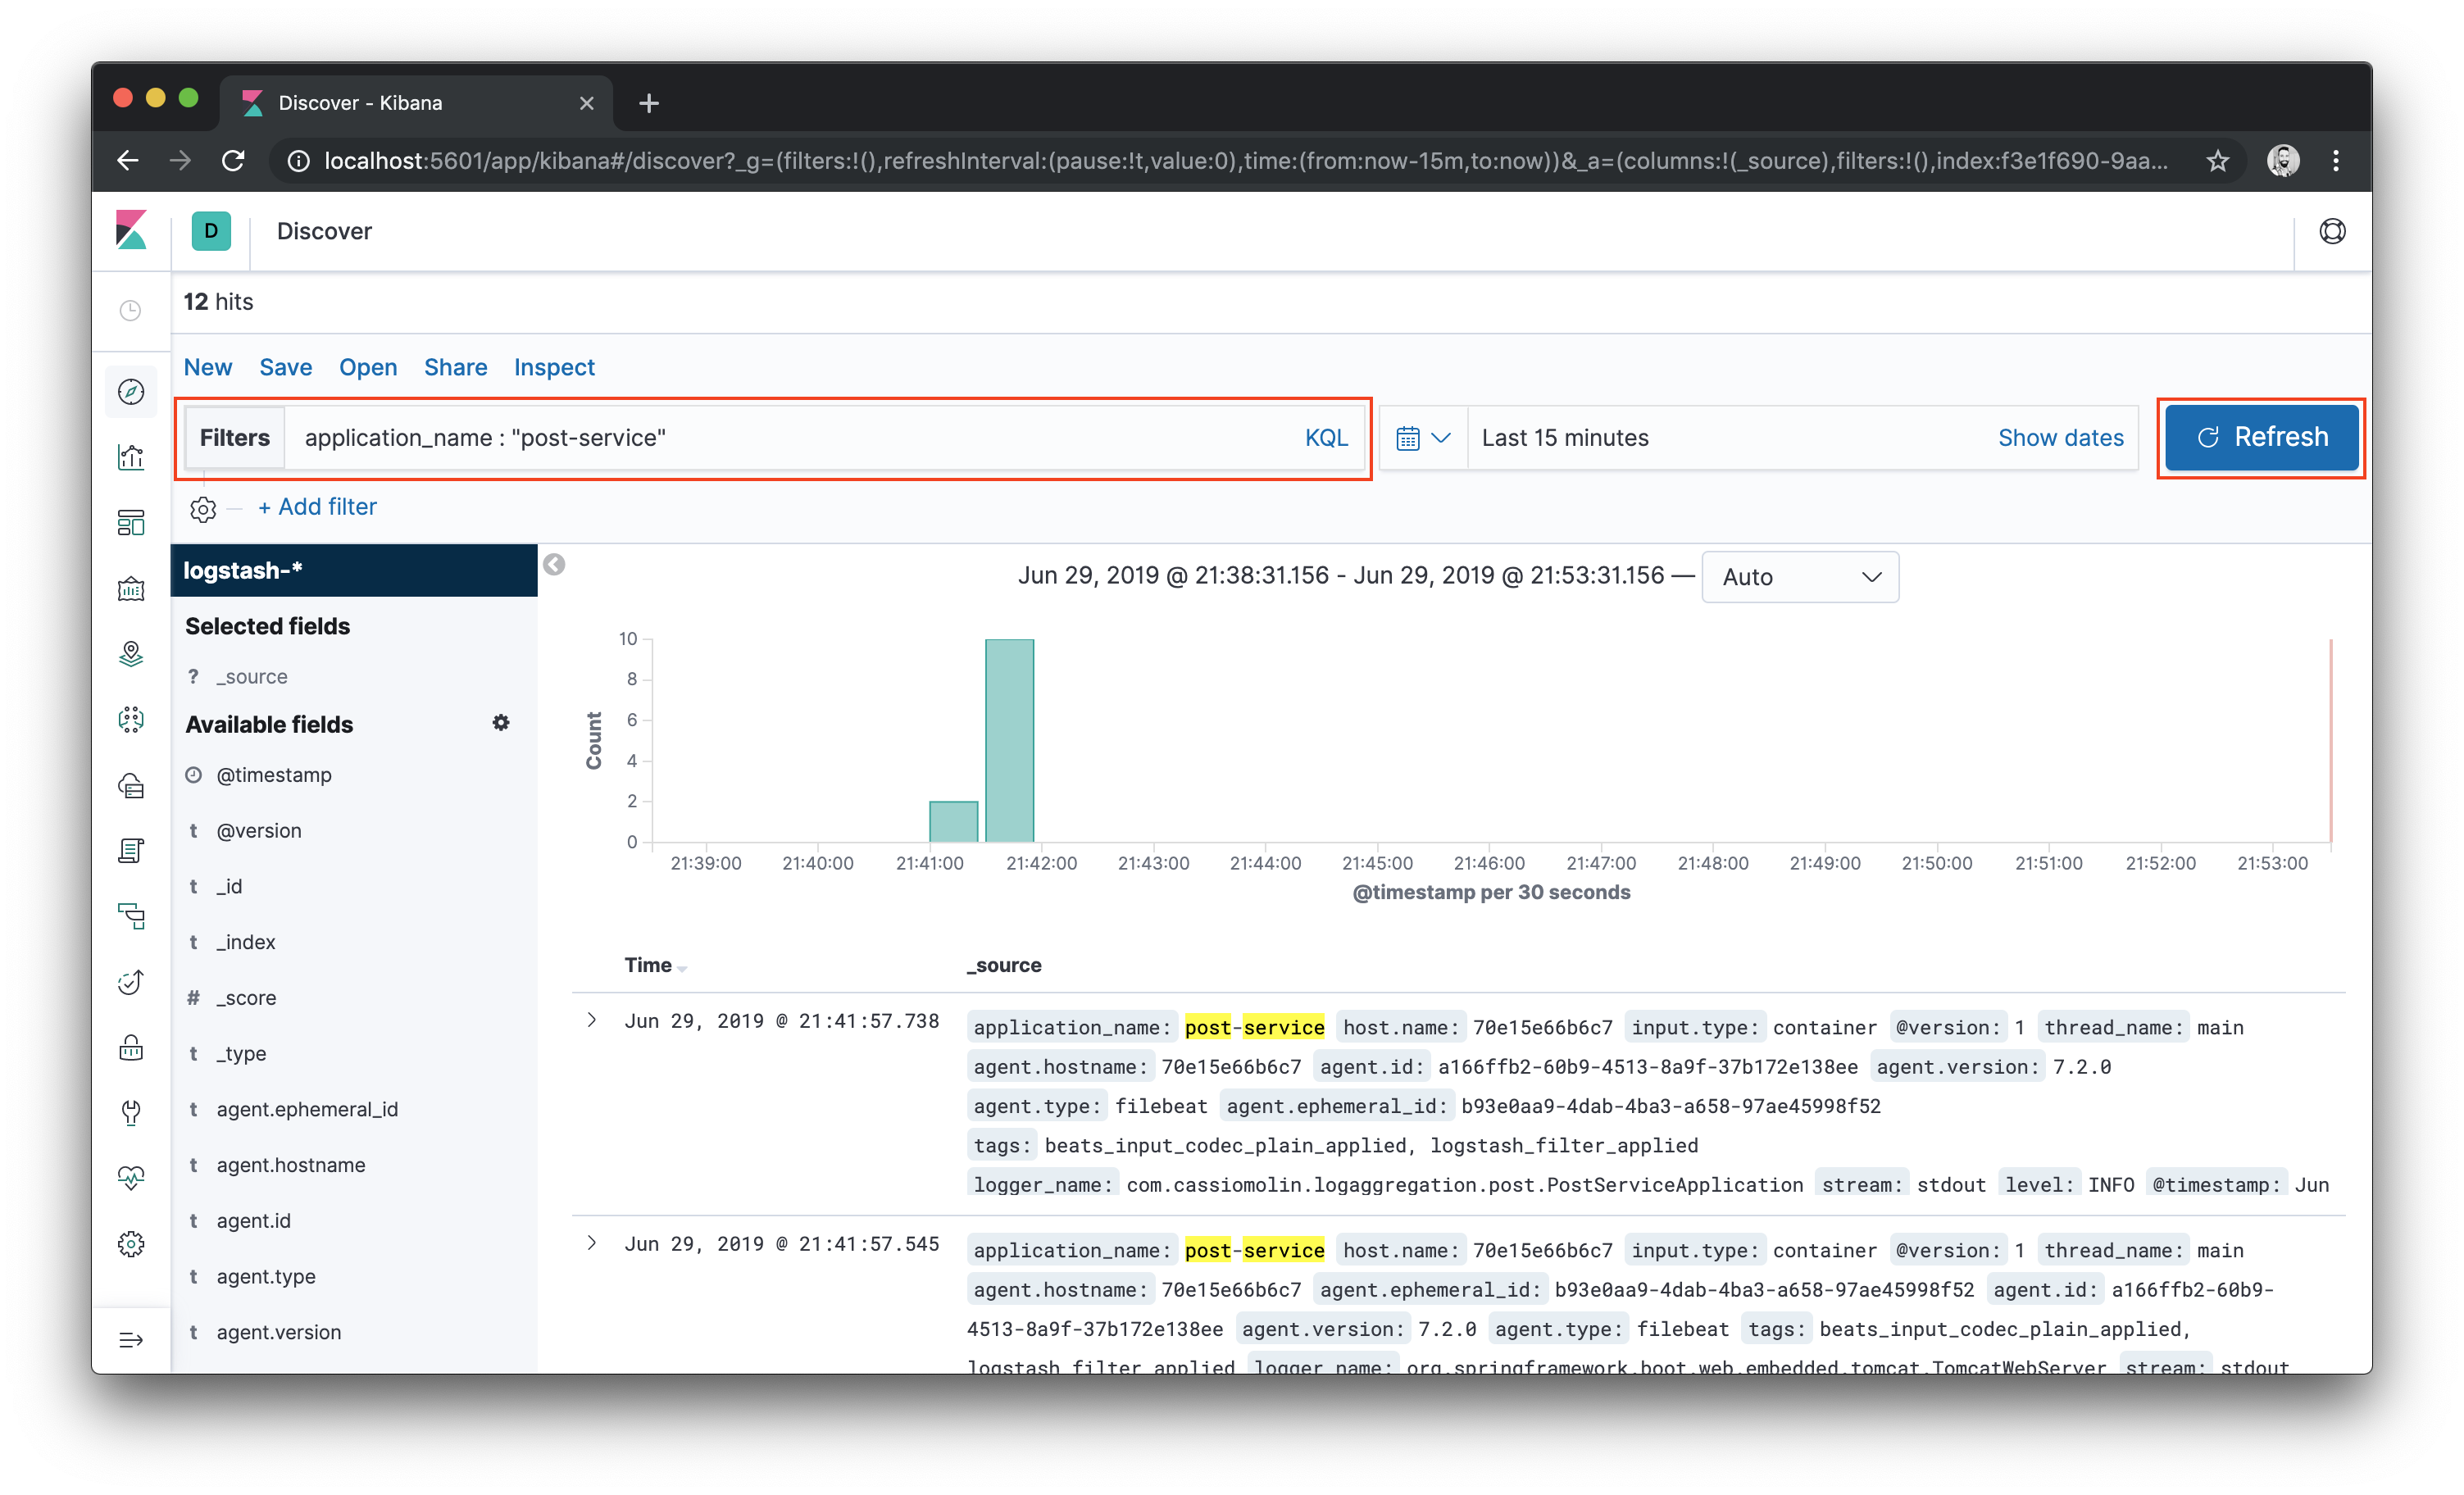
- To filter log events from the post service, for example, enter
application_name : "post-service"in the search box. Click the Update button and now you’ll see log events from the post service only.
Clean the filter input and click the Update button to view all logs.
Perform a
GETrequest tohttp://localhost:8001/posts/1to generate some log data. Wait a few seconds and then click the Refresh button. You will be able to see logs from the requests. The logs will contain tracing details, such as trace.trace_id and trace.span id.In the left-hand side, there’s a list of fields available. Hover over the list of fields and an Add button will be shown for each field. Add a few fields such as
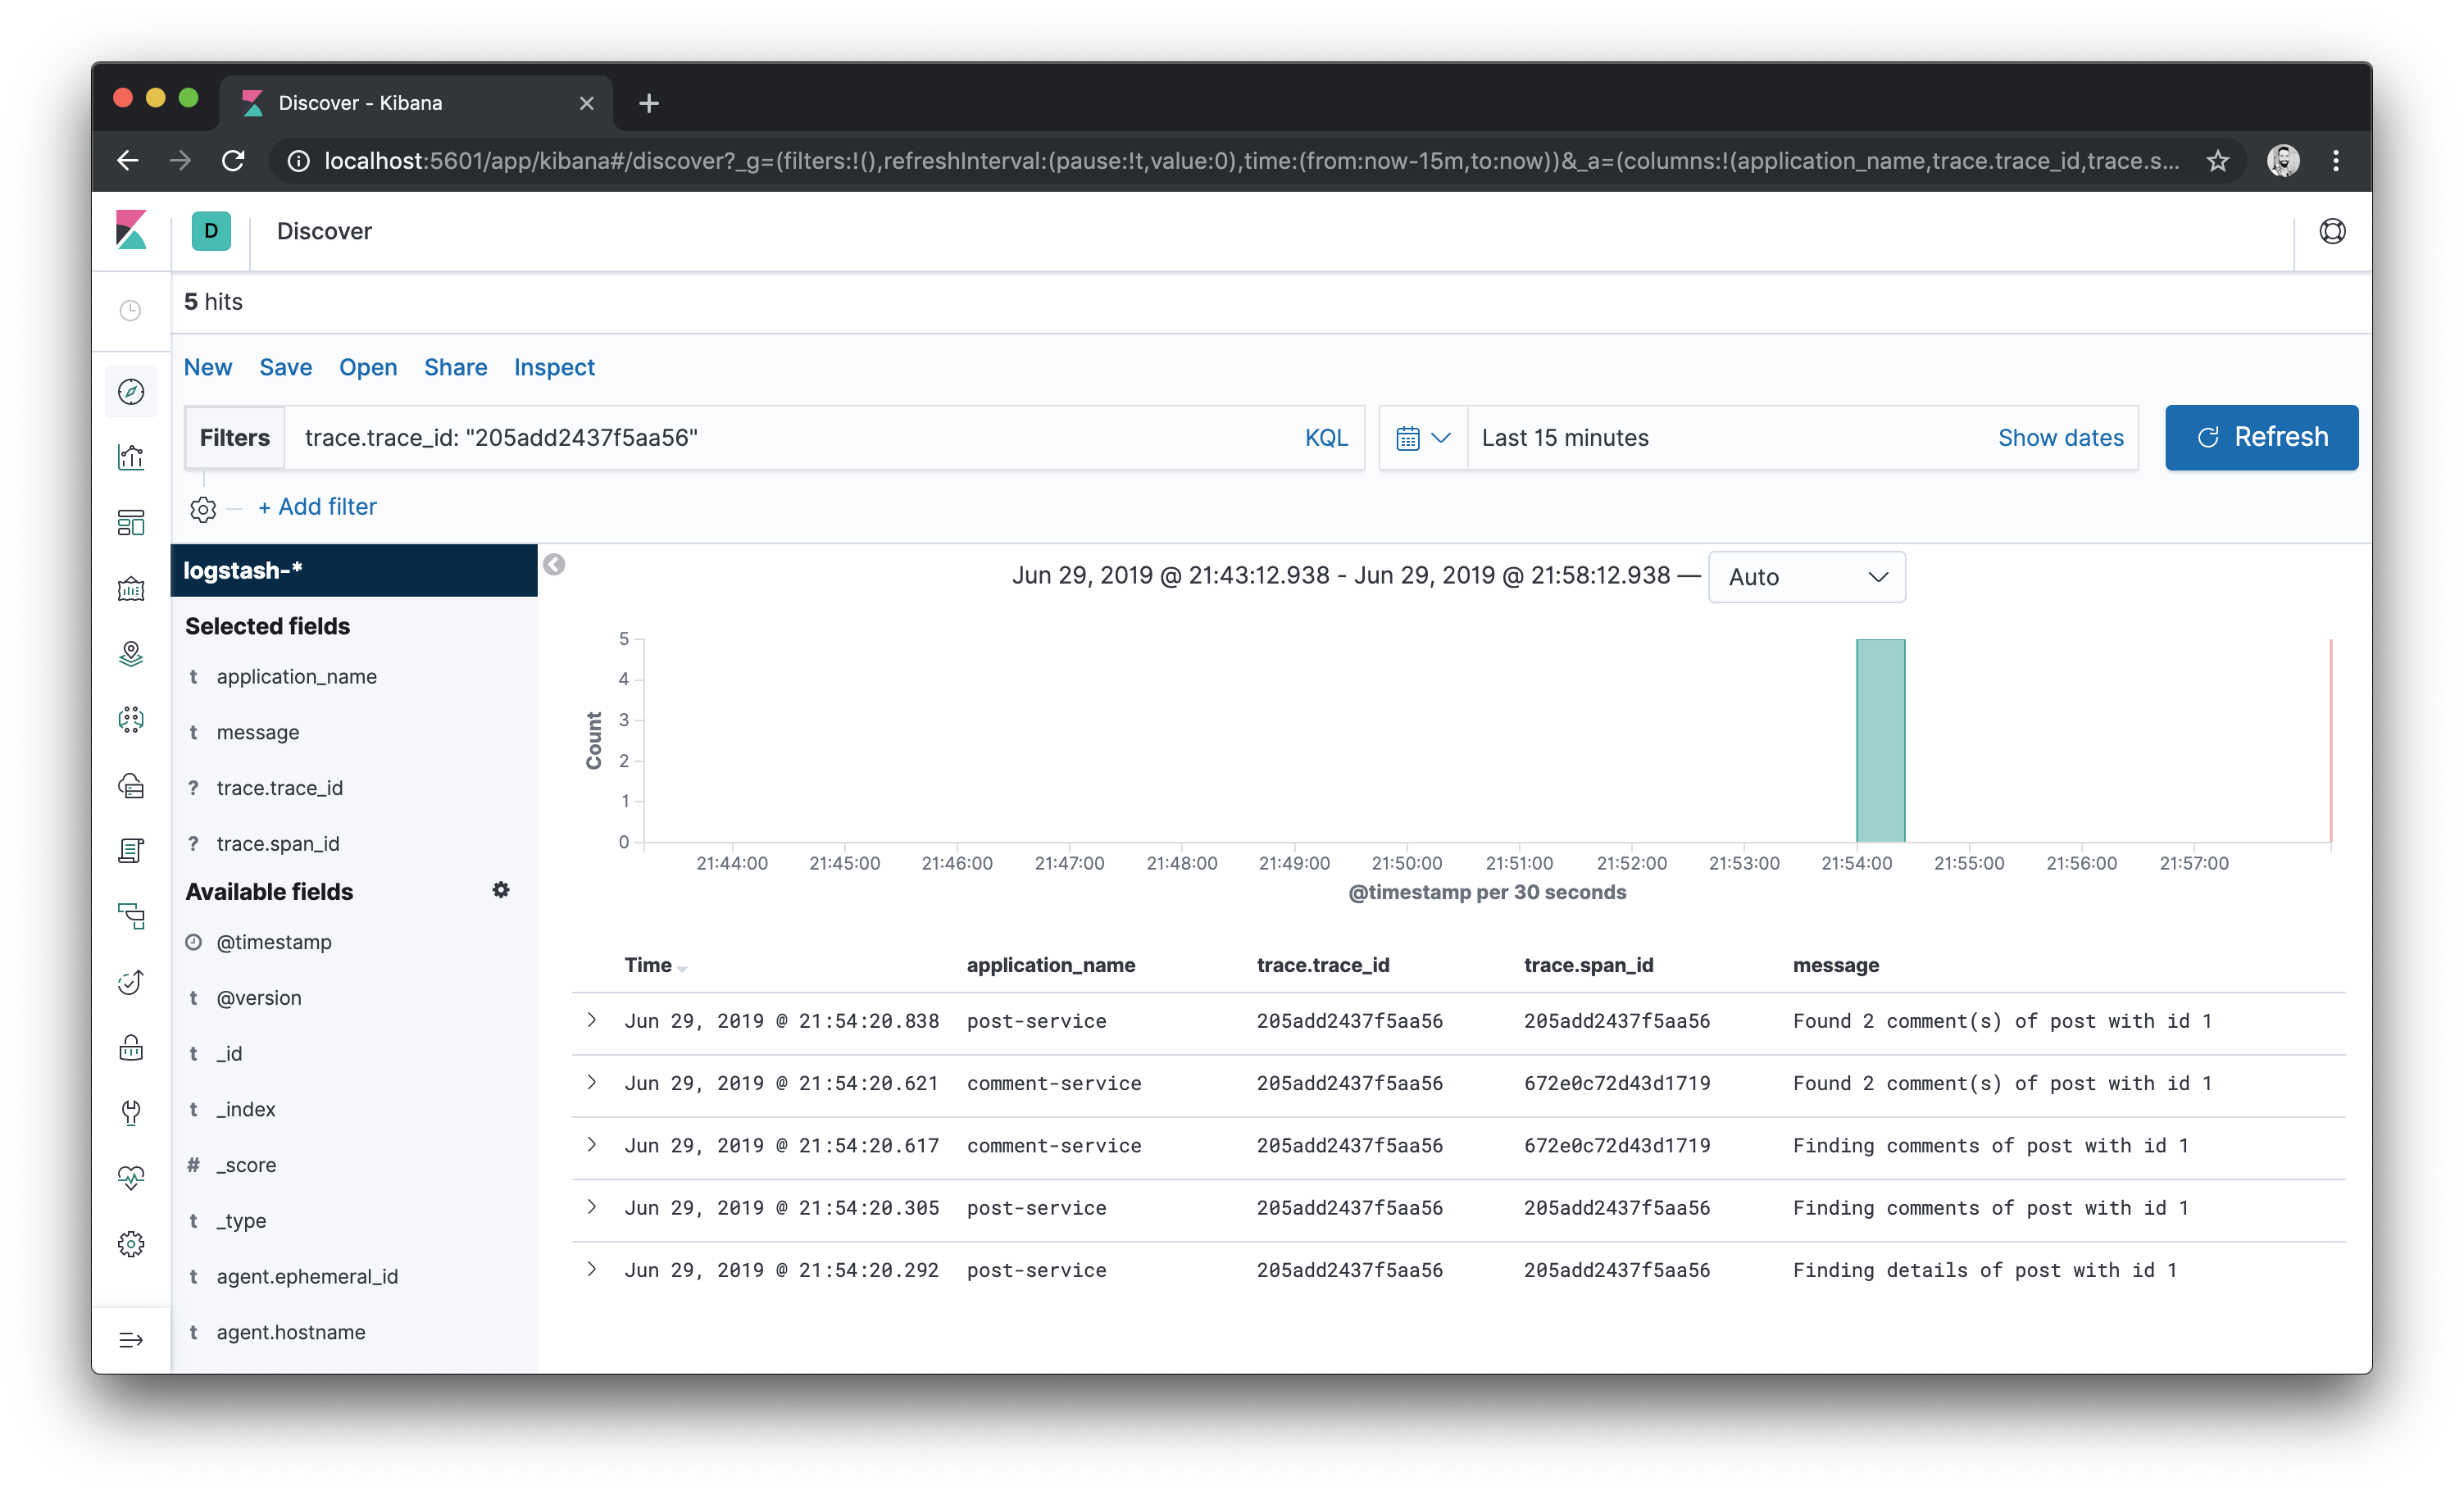
application_name,trace.trace_id,trace.span_idandmessage.Now let’s see how to trace a request. Pick a trace id from the logs and, in the filter box, input
trace.trace_id: "<value>"where<value>is the trace id you want to use as filter criteria. Then click the Update button and you will able to see logs that match that trace id.As can be seen in the image below, the trace id is the same for the entire operation, which started in the post service. And the log events resulted from a call to the comment service haven been assigned a different span id.
To stop the containers, use
docker-compose down. It’s important to highlight that both Elasticsearch indices and the Filebeat tracking data are stored in the host, under the./elasticsearch/dataand./filebeat/datafolders. It means that, if you destroy the containers, the data will be lost.